23 Sept 2026 · 6 min read
Your plant has been observable for decades. The software carrying it hasn't.
scada · open-source · practice
A value on the control-room screen is four minutes behind the plant. The pressure it shows is real, just old, and somewhere between the transmitter and the screen something is holding on to it. Which box?
Your historian can tell you what that pressure was at 02:14 last March, to the second, with a flag saying whether the reading could be trusted. It can't tell you which of the half-dozen pieces of software in the path was sitting on the reading, and in most plants nothing else can either. The answer gets found by restarting things in a sensible order until the number moves again, and the incident report says the problem cleared.
That isn't carelessness. The historian was built to watch the process, and it does that very well. The software in the middle arrived one piece at a time, each piece installed to solve that month's problem, and none of them came with a historian of its own.
SEVEN BOXES FROM THE TRANSMITTER TO THE SCREEN
What the four letters are
LGTM is what Grafana Labs calls four open-source tools it maintains, and the pun is deliberate: in code review, LGTM is what you type to approve a change, "looks good to me". On a plant that's either a joke or a warning. Loki keeps logs, the lines of text software writes about itself, and stays cheap by indexing a few labels instead of every word. Grafana draws screens. Tempo follows a single request as it hops between many small programs, so you can see which one was slow. Mimir keeps numbers over time.
If you want a plant anchor, Mimir is a historian, Loki is an event journal and Grafana is an HMI. Tempo has no counterpart at all, which matters later.
FOUR LETTERS, DECODED
Most plants have met exactly one of the four. Grafana is the letter you can see, so it's the one that gets adopted, usually drawing trends of values the HMI already shows. In my experience it's also the letter that helps a plant least.
The pitch I'd turn down
The pitch tends to go like this: the historian licence is expensive, all four tools are free, so put the process data into Mimir and draw it in Grafana. I'd turn that down, and not because the software is weak. It was built on a different promise.
Software monitoring is allowed to lose readings. If a web server's memory figure goes missing for a minute nobody cares, because the next one is coming and the trend is what matters. A plant reading can end up as evidence in a trip investigation, a billing dispute or a failed batch, and somebody has to be able to say it was recorded, when, and whether it was any good.
The defaults show the difference. Out of the box, Mimir refuses a reading that arrives after a newer one for the same signal, and any reading more than an hour older than the newest it has received from anywhere. That's exactly what a site sends when its link comes back after a long cut and it replays what it buffered, while every other site has kept reporting. A plant historian is built to accept that backfill and close the gap. Mimir, as shipped, turns the replay away and the gap stays. There's a setting that changes this; you have to know to turn it on. Nor does a Mimir reading have anywhere to say it's bad or uncertain: each one is a name and a few labels, a time and a number. Plant protocols such as OPC UA give every value a quality, good, uncertain or bad, for a reason.
THE SAME REPLAY, TWO DIFFERENT PROMISES
There's a second cost, and I've paid it myself. Some years ago I built a side channel reading controllers straight into a time-series database with Grafana on top. It answered that week's question, and it made a second owner for tags that already had one. "Put the process into Mimir" is the same move with better software, and it's the move a two-minute link cut punishes hardest.
Where it beats anything a plant has
Now look at the middle of the chain instead: the comms driver, the OPC server, the edge gateway, the broker, the service that writes to the historian, the Windows machines they run on, and the switches between them. Every one writes logs and keeps counters: how many readings are queued, how often it reconnected, how full its buffer is, how much disk is left. None of that is recorded anywhere a person would look, and it's exactly what answers the question at the top of this page.
This is the job LGTM was built for: software watching software, where an occasional lost sample genuinely doesn't matter because what you want is the shape of a queue over the last hour and the log line that went with it. Some brokers publish their counters in the format Mimir reads out of the box, others need a small free add-on, and there are ready-made collectors for Windows machines and network switches. Nothing on the process side has to change.
Read it L, M, G, and leave the T
If I were starting on a plant tomorrow I'd take the letters in a different order.
Logs first. The software in the middle is already explaining itself in text, in folders on six different machines, and nobody reads them. I wrote recently about a gap whose whole explanation sat in one log line that nobody opened. Loki is cheap to run, for the reason above, and it turns those folders into one thing you can search on the night the screen goes wrong.
Numbers second, and only for the data path: queue depth, buffer fill, reconnects, disk, clock drift. That's a few hundred signals for the whole path, not fifty thousand process tags, and it's a size Mimir handles without anyone tuning it.
The screen third. One page that shows the data path, rather than another copy of process graphics the HMI already draws.
Tempo I'd leave out. It exists to follow one request through dozens of small services, and a plant reading isn't a request. It's a value moving along a chain of five or six boxes you can name from memory. If your data path ever grows into dozens of services, look again. Until then it's another thing to keep running that answers nothing you're asking.
THE ORDER A PLANT SHOULD TAKE THEM IN
What it costs
None of this is free. It's three more services on a network that usually can't reach the internet, and each one needs disk, patches and somebody who owns it when it breaks. The SCADA software itself is often the hardest box to see: Ignition and Kepware, two of the most common, don't document a native way to publish their internals in the format Mimir reads as of September 2026, so somebody writes the bridge. The all-in-one package Grafana publishes is meant for trying the stack out, not for running a plant on. The licence is AGPL, which is fine for running inside your own site and worth a proper read if you ever ship it inside something you sell. And whatever watches the data path needs watching too. If Loki stops taking logs, you want to hear about it the same day.
To be fair to the pitch: for a short trial, or a test rig where nobody will ever ask what happened at 02:14, putting process values into Mimir is fine. It's the long, evidential record where I'd keep the historian.
A test for this week
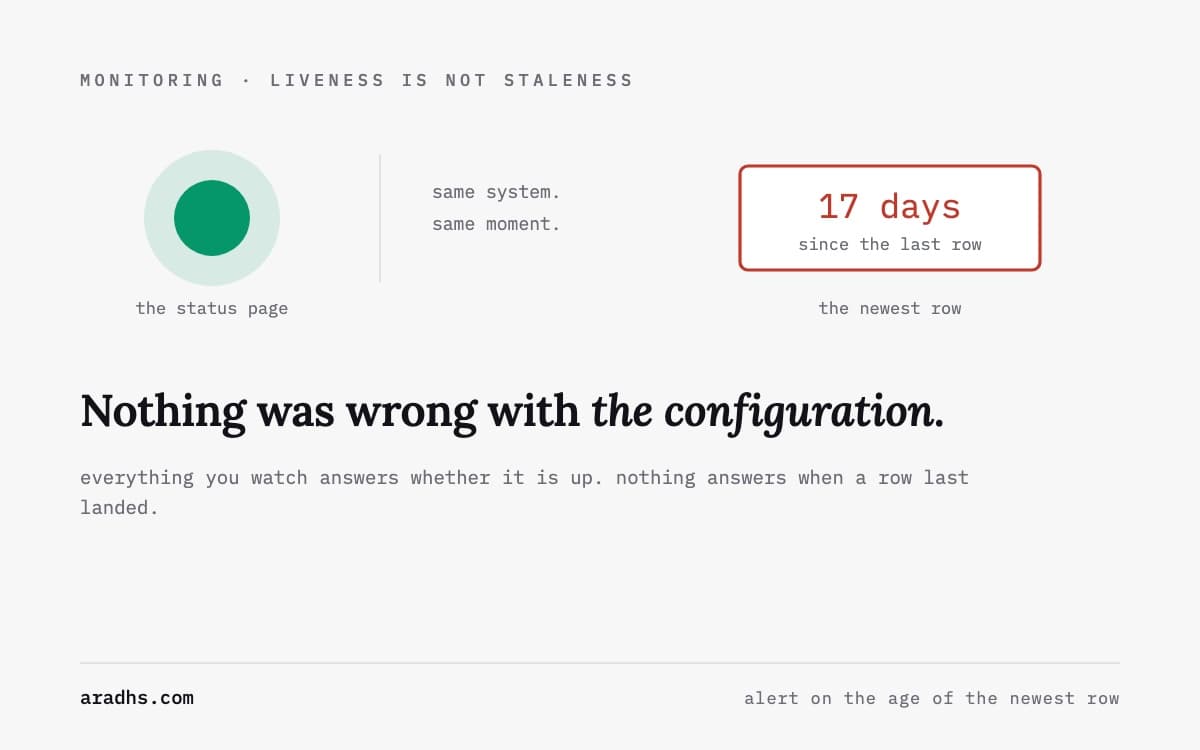
Pick the last time a value on a screen was late, frozen or wrong. Using only what was recorded at the time, not anybody's memory, can you name which box was holding it, for how long, and why?
THE LAST INCIDENT, AND WHAT RECORDED EACH PART OF IT
If the answer came from a restart, a hunch or "it cleared on its own", that's your observability gap. It isn't in the historian. It's in everything between the sensor and the screen, which is the one place the open-source stack beats anything a plant already owns.
Keep reading
Newsletter
New essays, by email.
SCADA, cloud, AI, and the plant floor — a short email when something new is published. No noise, unsubscribe anytime.