Concluded·4 Aug 2026 · 9 min read
The same plant pipeline, built twice: Node-RED against Redpanda Connect
Redpanda Connect 4.102.0 · Node-RED 4.0.9 · Mosquitto 2 · TimescaleDB pg17 · Docker Compose · Proxmox LXC
Somebody is going to send you a link to Redpanda Connect and suggest it replaces the Node-RED instance that has been moving your plant data for two years. This is the measurement I ran before answering that.
The rule I set myself was that both sides had to do the identical job, with identical batching, against the same broker and the same database, and that loss had to be countable rather than estimated. Every message carries a per-site monotonic sequence number and every load step records exactly which sequence range it published, so delivered is a subtraction over a known range, not a sample.
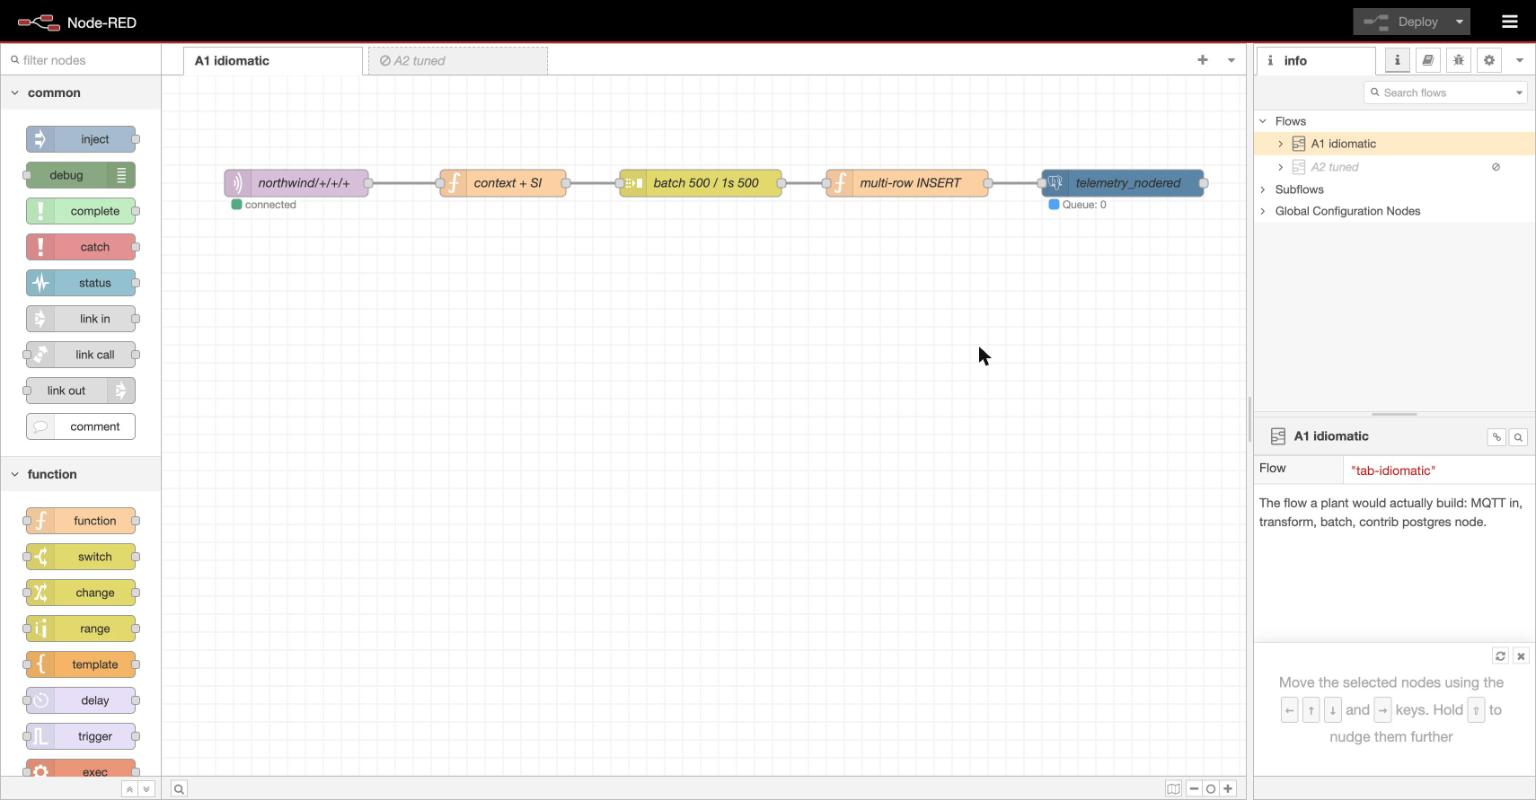
The rig
Four simulated sites (Rotterdam, Houston, Seville, Leipzig) publish JSON telemetry over MQTT at QoS 1. Readings arrive the way a PLC actually presents them: scaled integers in whatever unit the vendor shipped, so degF, gpm, psi and mils all have to be converted to SI at the point of entry. Both consumers hold durable sessions on the same broker.
The database was deliberately over-provisioned — 1 GB shared buffers,
synchronous_commit=off — precisely so that it could never become the thing
under test. If Postgres had been the bottleneck the whole comparison would have
been measuring Postgres.
To keep it a benchmark rather than a hit piece, the Node-RED side batches
properly (a join node accumulating 500 messages or one second, then a single
parameterised multi-row INSERT) rather than doing the row-at-a-time thing that
would have made the result a foregone conclusion.
THE RIG
Experiment 1 — throughput, and the finding that wasn't
Six steps, sixty seconds each. First the honesty check, because a ramp whose publisher cannot reach the target proves nothing about either consumer:
| Target msg/s | Sent | Achieved | % of target |
|---|---|---|---|
| 500 | 30,000 | 493/s | 98.5 |
| 1,000 | 60,000 | 981/s | 98.1 |
| 2,000 | 120,000 | 1,976/s | 98.8 |
| 5,000 | 300,000 | 4,955/s | 99.1 |
| 10,000 | 600,000 | 9,940/s | 99.4 |
| 20,000 | 1,200,000 | 19,894/s | 99.5 |
The top step is real. And both pipelines delivered all of it:
| Target msg/s | Sent | Connect | Node-RED | Connect % | Node-RED % |
|---|---|---|---|---|---|
| 500 | 30,000 | 30,000 | 30,000 | 100.00 | 100.00 |
| 1,000 | 60,000 | 60,000 | 60,000 | 100.00 | 100.00 |
| 2,000 | 120,000 | 120,000 | 120,000 | 100.00 | 100.00 |
| 5,000 | 300,000 | 300,000 | 300,000 | 100.00 | 100.00 |
| 10,000 | 600,000 | 600,000 | 600,000 | 100.00 | 100.00 |
| 20,000 | 1,200,000 | 1,200,000 | 1,200,000 | 100.00 | 100.00 |
Zero duplicates, zero loss, 2,310,000 messages each.
PUSHING THE RATE UP IN STEPS
Each step ran for a minute. Every reading carried a number, so what arrived could be checked against what was sent, one for one, rather than sampled.
Total counts can hide a pipeline that falls badly behind during a step and catches up in the drain window, so lag matters more than the totals do. It was sub-second throughout, and Node-RED was ahead at five of six rates because Connect's one-second batch period dominates when traffic is light:
| Target msg/s | Connect avg / max | Node-RED avg / max |
|---|---|---|
| 500 | 0.50 / 1.00 | 0.51 / 1.02 |
| 1,000 | 0.25 / 0.99 | 0.25 / 0.50 |
| 2,000 | 0.13 / 0.99 | 0.13 / 0.26 |
| 5,000 | 0.05 / 0.39 | 0.05 / 0.11 |
| 10,000 | 0.03 / 0.09 | 0.03 / 0.06 |
| 20,000 | 0.03 / 0.74 | 0.03 / 0.13 |
Resource peaks over the run were the only real separation, and they did not change any outcome on this hardware:
| Peak CPU | Peak RSS | |
|---|---|---|
| Redpanda Connect | 143.5% | 70.1 MB |
| Node-RED | 103.1% | 141.2 MB |
Node-RED stops at one saturated core because Node.js is single-threaded. Connect passes 100% because the Go runtime spreads across cores. Given six cores, that bought nothing. Given one core on an edge gateway, it is the ceiling.
Experiment 2 — sixty seconds without a database
Steady 2,000/s. At t=45s the database stopped for sixty seconds, then came back, with both consumers left running throughout and given nearly two minutes to drain.
| Sent | Landed (unique) | % | Duplicates | |
|---|---|---|---|---|
| Redpanda Connect | 360,000 | 360,000 | 100.00 | 2 |
| Node-RED | 360,000 | 240,500 | 66.81 | 0 |
Node-RED lost 119,500 readings. Not delayed — gone, with no backlog to replay.
THE DATABASE, SWITCHED OFF FOR A MINUTE
I repeated the entire run before believing it and both figures reproduced to the decimal place.
Bucketing on when each reading was produced rather than when it was written shows the loss is not a slowdown. It is one contiguous block eleven windows wide, spanning t=45s to t=100s, which is the outage exactly. Node-RED recorded nothing at all in that period. Connect's rate never dipped.
THE SHAPE OF WHAT WAS LOST
A warning for anyone repeating this: Connect's recovery looks like a hang.
For several minutes after the database returned it advanced at roughly two
messages a second with input_received almost frozen, then drained the whole
backlog in one burst. My 45-second drain window was far too short and produced a
confident 24.40% on the first reconcile, which I nearly wrote up as a Connect
failure. It reaches 100%; it just takes its time getting there.
Both behaved exactly as designed, and the design difference is a single decision about when the broker is told the message was handled. Connect's output withholds the acknowledgement until the insert commits, so a failed batch stays owed and is redelivered. The Node-RED flow acknowledges on receipt, as messages enter the canvas; by the time the insert fails the broker has already discarded its copy, and the catch node holds the only reference to data that is now homeless.
You can hand-build retry into a flow. But you are then implementing a durable queue inside a process that has no durable storage, and doing that properly is a bigger job than the flow it is protecting.
THE MECHANISM
Signs the moment a reading turns up. If the write fails after that, the network has already thrown its copy away and there is nothing left to retry. You never get the same reading twice. You do get holes.
Signs only once the reading is safely in the database. A failed write stays owed and comes back. You never get holes. You do occasionally get the same reading twice, which a historian can normally live with.
Experiment 3 — killing both processes outright
Same stream. At t=45s both consumers were SIGKILLed and left dead for fifteen
seconds.
| Sent | Landed | % | Lost | |
|---|---|---|---|---|
| Redpanda Connect | 360,000 | 359,820 | 99.95 | 180 |
| Node-RED | 360,000 | 359,920 | 99.98 | 80 |
Node-RED came out marginally ahead, which reads as a contradiction until the mechanism is clear: a dead consumer is not consuming. The broker holds the backlog against the durable session and redelivers on reconnect, so nothing was acknowledged and almost nothing was lost. Losses on both sides are bounded by what was in flight at the instant of the kill, not by how long the process stayed down.
Which leaves a conclusion I did not expect to write. Node-RED survives its own death far better than it survives a database hiccup. Killing it is safe. Leaving it running while the thing underneath it is broken is what destroys data.
WHAT EACH ONE COST TO RUN
Experiment 4 — what it can actually talk to
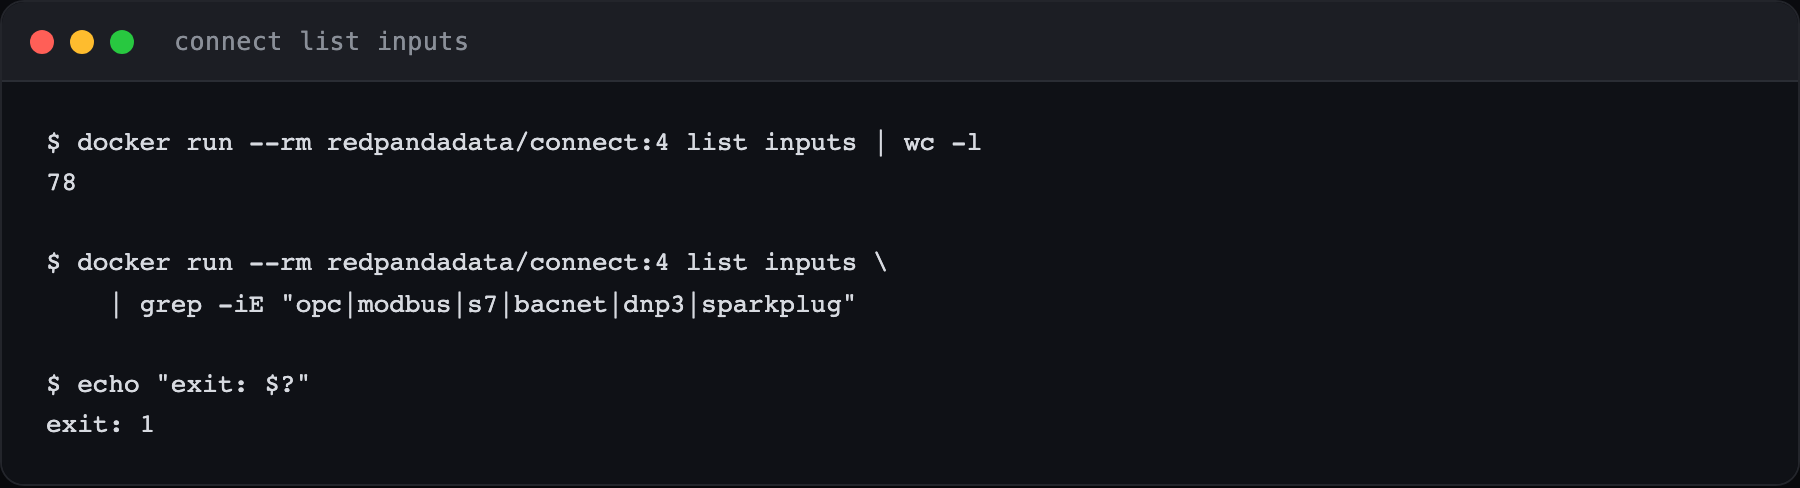
Seventy-eight input connectors, and not one industrial protocol. No OPC UA, no Modbus, no S7, no BACnet, no DNP3, not even Sparkplug.
This is not an oversight, it is a statement about where the project starts: at
the broker. Everything to the left of the broker — the half of the job that
involves a plant — is out of scope. It is also exactly why the United
Manufacturing Hub maintains benthos-umh, a fork whose main contribution is
adding OPC UA, S7 and Modbus to this same engine, which is the engine I found
underneath UMH Core when I took it apart.
WHAT IT CAN ACTUALLY TALK TO
kafka · mqtt · amqp · nats · sql · s3 · gcp · redis · http · …
opc ua · modbus · s7 · bacnet · dnp3 · sparkplug
Experiment 5 — the test runner earns its place
Connect ships a unit-test runner in the same binary that runs the pipeline. I wrote four tests against the transform. Three passed. The fourth failed and found a real bug in my own mapping:
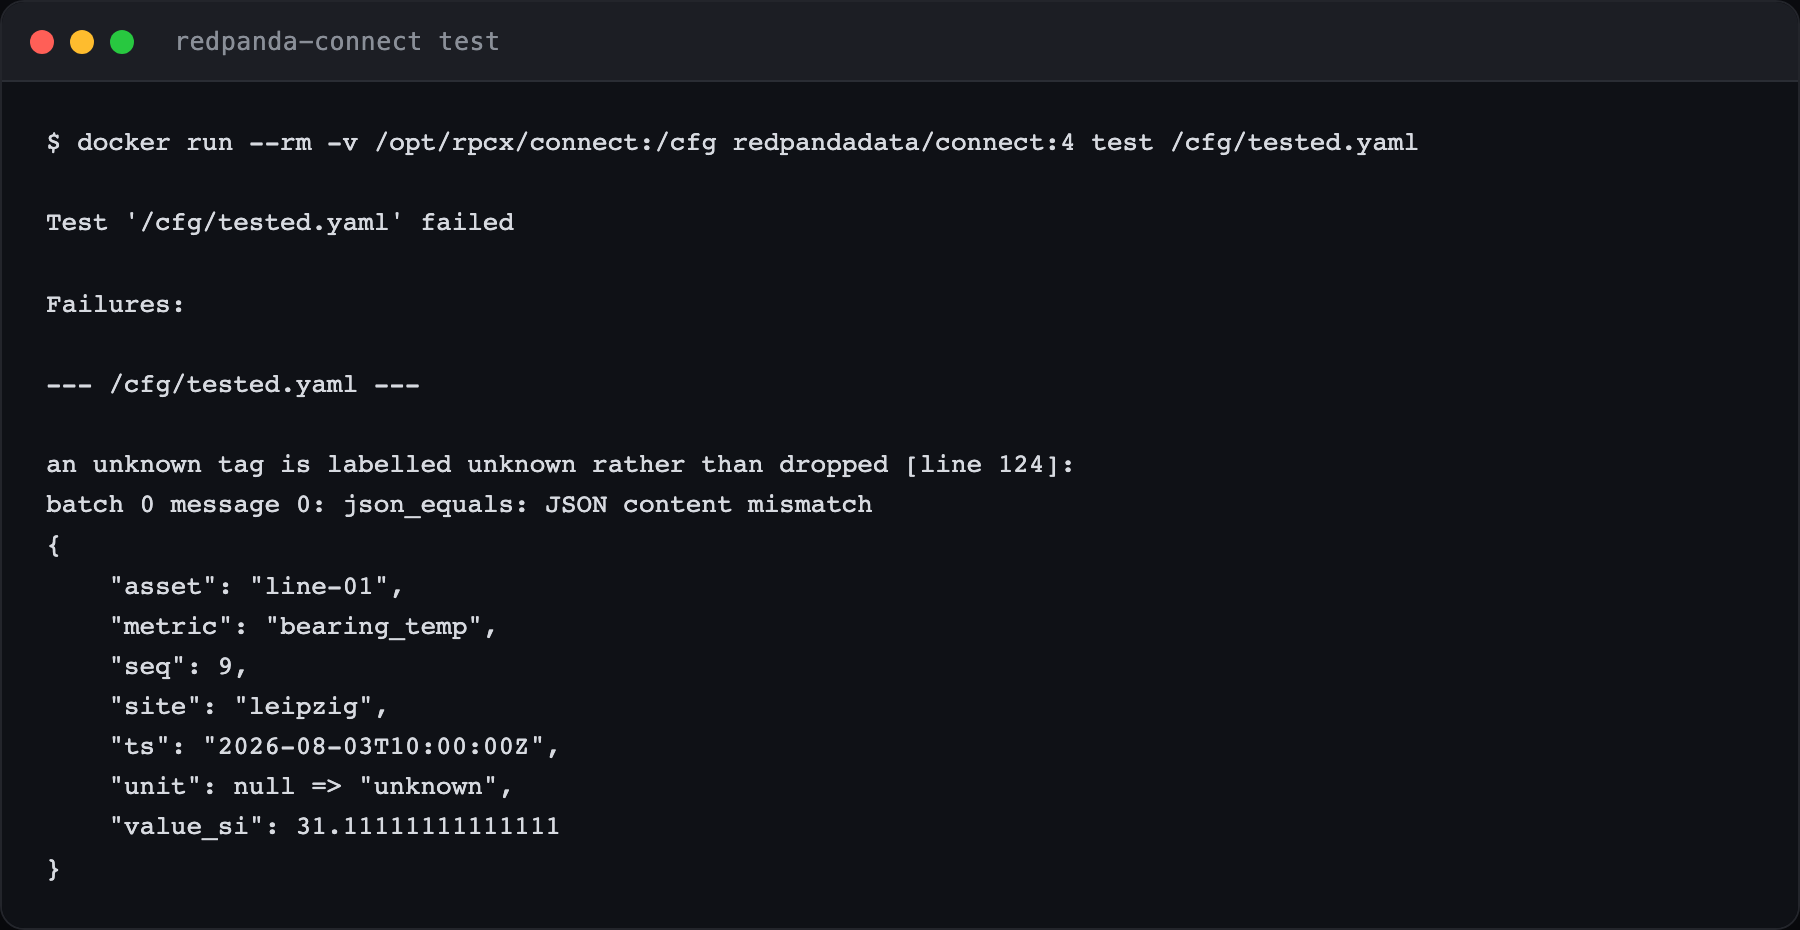
$units.get(this.tag).catch("unknown") never fires, because a missing key
returns null rather than raising an error. .or("unknown") is the correct
guard.
The part worth keeping is not the bug, it is which test found it. All 2.31 million messages of load testing walked straight past it, because every message used a tag already in the table. It would have surfaced six months later, at a plant, the first time somebody added a sensor — and it would have surfaced as silently wrong data rather than as an error.
Configuration surface
| Lines | Bytes | |
|---|---|---|
flows.json | 221 | 6,971 |
pipeline.yaml | 67 | 2,099 |
Of the flow's five active nodes, 44% of the JSON is hand-written logic and every
node carries x/y canvas coordinates. Dragging a node to tidy the canvas
changes the file without changing behaviour, which is a small thing until it is
a code review.
Three harness bugs, recorded because two of them lied
Every one of these produced a plausible result before I caught it. That is the point of writing them down.
1. Bloblang variables are not fields. I wrote scaled - 32.0 where I meant
$scaled - 32.0. Bloblang resolved the bare name as this.scaled, which is
null. Connect logged an error per message, kept running, and inserted nulls
until the not-null constraint rejected them. The container stayed up and never
stopped looking healthy.
2. Replay contaminated the next run. After fixing the mapping, Connect landed 19,489 rows for 10,000 published messages. It had never acknowledged the failed batch, so the broker replayed the entire first run into the second one. Truncating the tables between runs is not enough — the durable MQTT sessions have to be destroyed too, which means removing and recreating the broker.
3. The publisher died inside its own outage test. Writing the ledger to the
database at each step boundary meant pg raised an unhandled error event the
moment the database stopped, killing the publisher at t=45s. The run finished
looking like a clean 88,000-message result and tested nothing at all. Ledger
writes are now buffered in memory and flushed once at the end, with retries.
That third one is the one I would flag to anyone building a fault-injection rig. The instrument has to survive the fault it is measuring, or it will hand you a tidy number for an experiment that never happened.
WHERE THE DECISION ACTUALLY IS
Verdict
Leave the Node-RED box where it is, and stop letting it write to the historian.
It remains the only one of the two that can reach your equipment, and its flow is a plain reviewable file, which was always the real argument for it. Keep it on acquisition and protocol translation, publishing into the broker where an acknowledgement carries weight. Put Connect on the far side of that broker, where at-least-once turns a database restart into two duplicate rows instead of a hole in the production record — assuming whatever you write into tolerates seeing a reading twice, which for a historian keyed on tag and timestamp is usually free.
Connect does not replace Node-RED. It replaces the one job Node-RED has always done badly, and leaves the rest alone.
The argument, minus the measurements, is in the article.
Newsletter
New essays, by email.
SCADA, cloud, AI, and the plant floor — a short email when something new is published. No noise, unsubscribe anytime.