The Lab.
On the bench — things I install, break, and measure on real hardware. Every experiment is actually run: real load tests, real screenshots, a verdict at the end. When one hardens into a conviction, it graduates to writing.
 Concluded
Ignition 8.3.8 (b2026071409) · Docker on an unprivileged Proxmox LXC · TimescaleDB 2.x on PostgreSQL 16 · gwcmd.sh backup, container -r restore
What a gateway backup actually restores
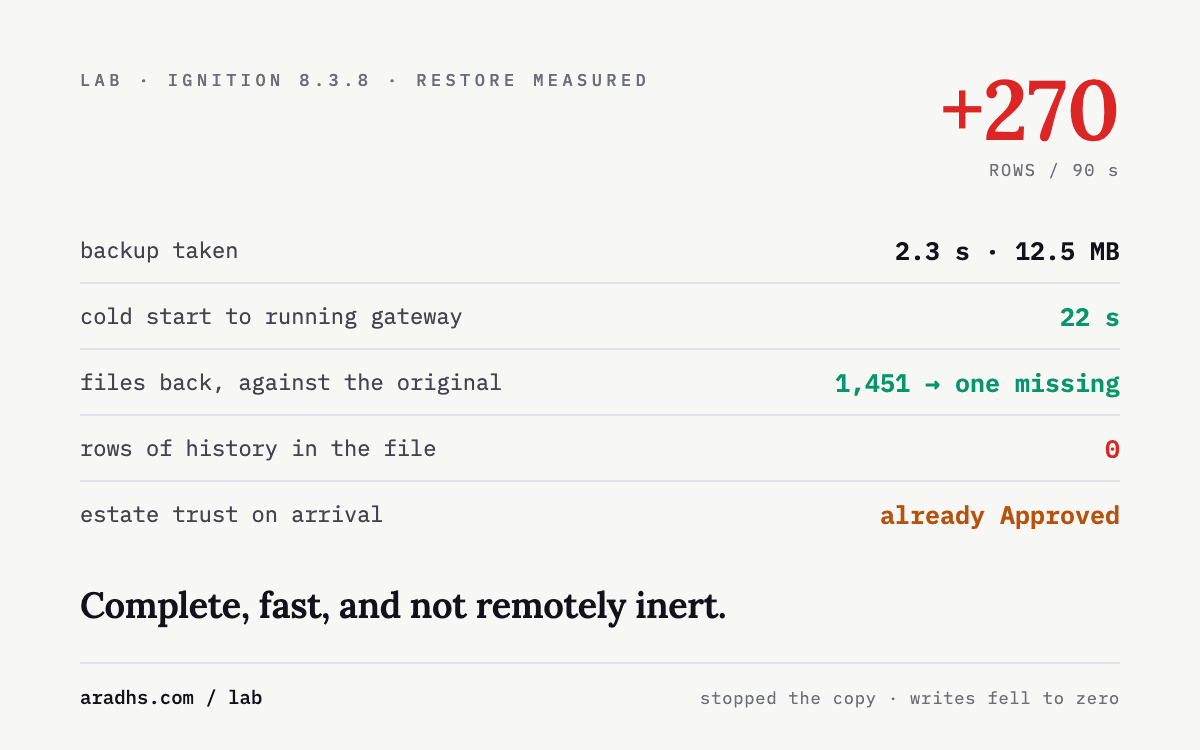
A 12.5 MB gateway backup taken in 2.3 s and restored into a clean container in 22 s, then compared against the original file by file: 1,451 versus 1,457 files, 26 resource categories, one genuine difference. The restored copy also connected to the production historian using the credential inside the backup and wrote 270 rows in 90 seconds — zero when stopped — and arrived with gateway-network trust already approved. Two restore attempts failed first, both for reasons worth knowing.
Verdict Configuration restore is complete and fast — 22 s cold start to running gateway, and a file-by-file diff against the original found exactly one missing file, a leftover migration log. Process history is not in the backup at all; the backup carries the historian's address and password instead. That credential works on restore: the restored copy initialised its tag-history sink against the production database and wrote 270 rows in 90 s, falling to 0 rows in 90 s when stopped. It also came back with securityStatus Approved for both central gateways. A restore is therefore not an inspection — it is a second live, credentialled, pre-trusted member of the estate, and it must be tested on an isolated network.
30 Aug 2026 · 5 min read
 Concluded
Ignition 8.3.8 restored from gwbk into a clean container · TimescaleDB on PostgreSQL 16 · Docker on unprivileged Proxmox LXC · drill scripted, timestamps from date +%s.%N
Timing a recovery to the first good row
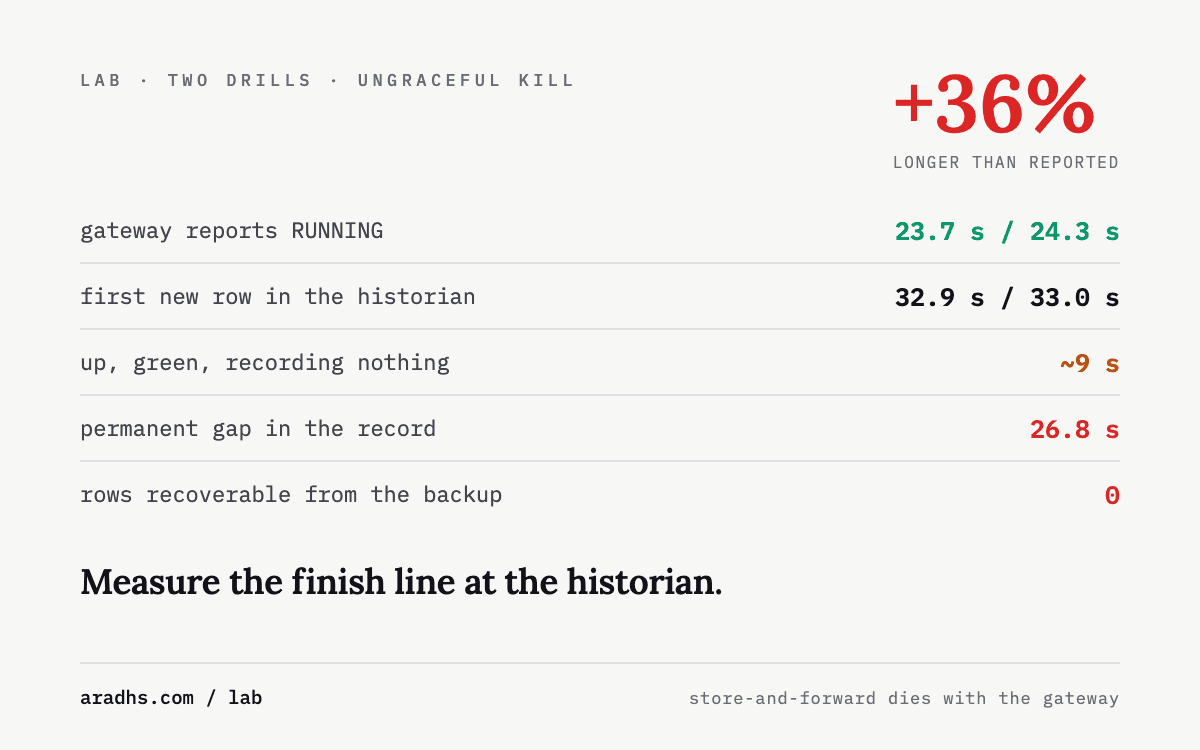
Two independent drills killing a gateway outright and timing recovery past the usual finish line. Gateway running at 24.3 s and 23.7 s; first new row in the historian at 33.0 s and 32.9 s — a 36% understatement if you stop the clock when the process starts. The permanent gap in the record measured 26.8 s, because a restored gateway carries configuration and no store-and-forward buffer.
Verdict Time-to-restore understates recovery by 36%. A gateway reports RUNNING at ~24 s and the first genuinely new row reaches the historian at ~33 s; both figures reproduced across two independent drills to within a second. Neither figure describes the damage, which is a 26.8 s permanent gap in the record — the dying gateway's store-and-forward buffer is inside the gateway, and the backup that rebuilds it carries no history. The drill is also the easiest possible version of the event: backup already local, historian volume intact, fresh trial licence, no certificate or DNS work. The computer-driven part of recovery is fast and is the only part anybody times.
29 Aug 2026 · 4 min read
 Concluded
syft 1.51.1 · grype 0.118.0 · CISA KEV catalogue 2026-08-27 · Ignition 8.3.8, Node-RED 4.1, EMQX, Mosquitto 2.0.22, N3uron 1.22.4, TimescaleDB pg16, Grafana
What a plant stack is actually made of
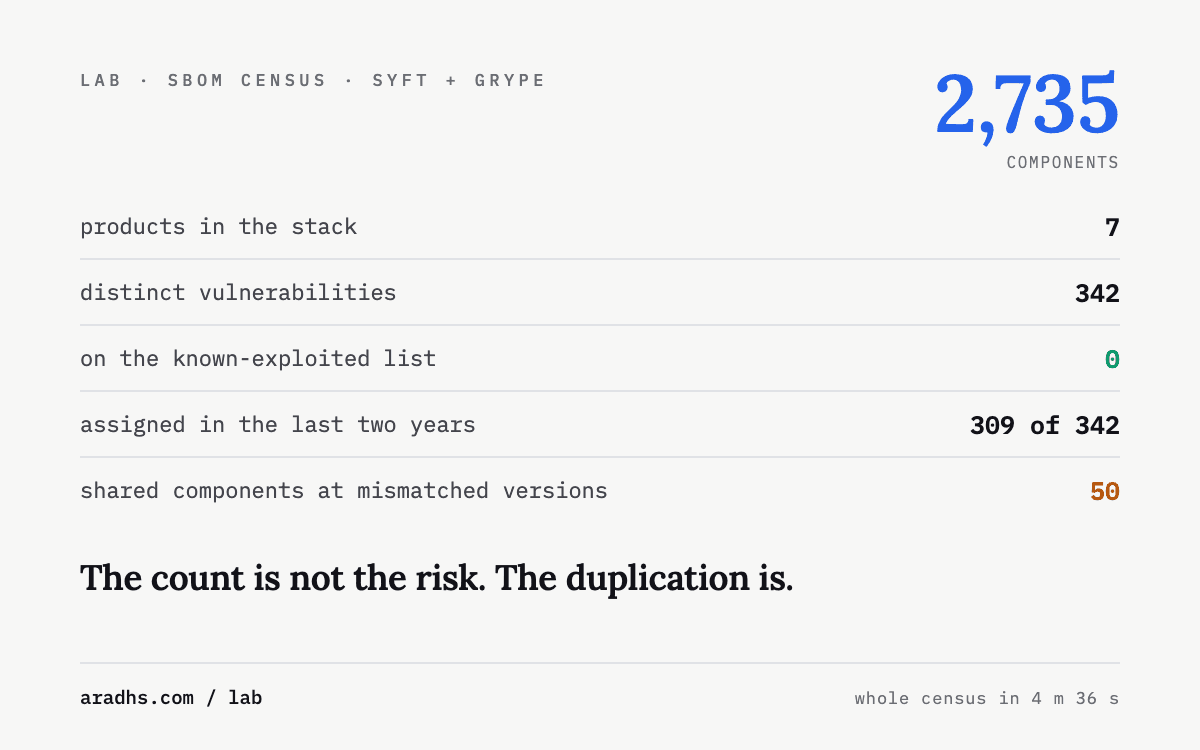
A software bill of materials for seven products that make up a small plant: 2,735 components, 1,286 vulnerability matches, 342 distinct CVEs, and zero intersection with CISA's known-exploited catalogue of 1,685 entries. 94% of the CVEs were assigned in the last three years. 63 components appear in more than one product and 50 of those at inconsistent versions. Whole census: 4 minutes 36 seconds with syft and grype.
Verdict The CRA's 24-hour clock is not answerable by intuition, and it turns out not to need to be: a full SBOM plus vulnerability census of a seven-product plant stack takes 4m36s with two open-source tools. The alarming number (342 CVEs) is the wrong one — none intersect CISA KEV, and 94% were assigned since 2024, which is what maintained software looks like rather than decay. The real exposure is component duplication: 63 CVE-carrying components appear in multiple products and 50 of those at differing versions, so 'do we ship this version?' has no single answer. Reconciling those beats patching any individual library.
28 Aug 2026 · 5 min read
 Concluded
OpenTofu 1.12.6 · bpg/proxmox provider 0.66 · Proxmox VE 9.1 LXC · git daemon over the plant segment · Ubuntu 24.04 containers
What drift detection actually catches: three tiers on a small estate
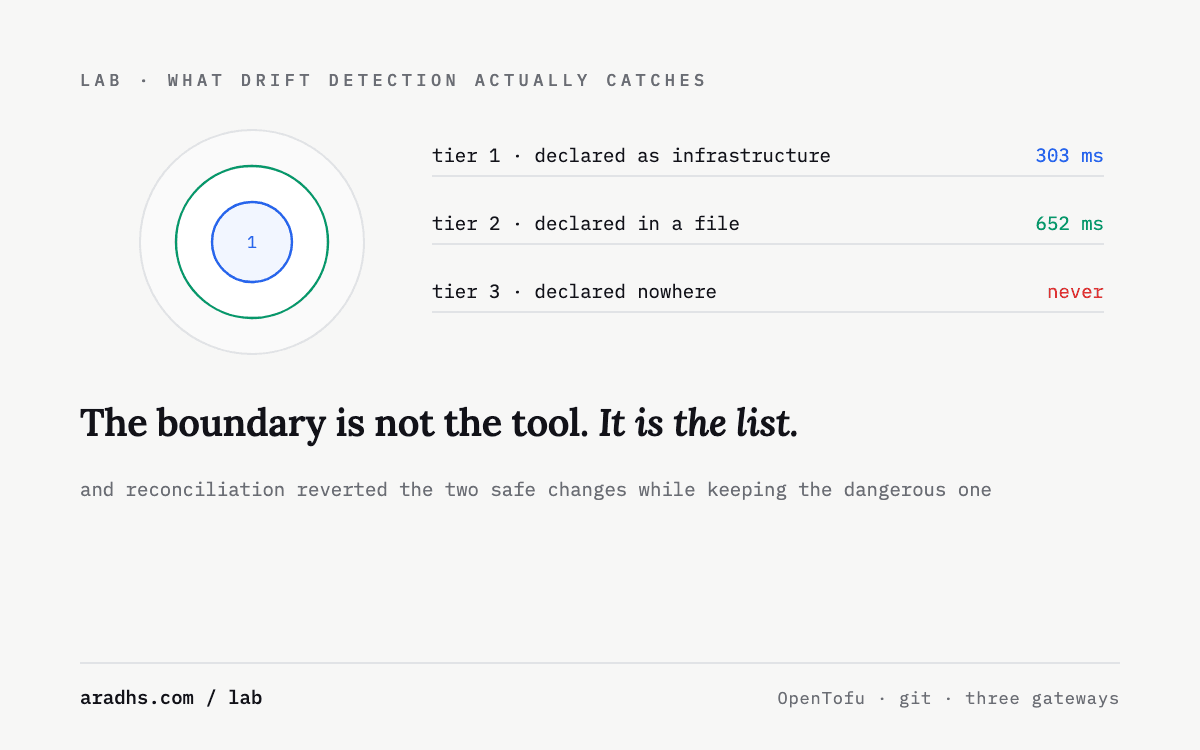
A three-gateway estate provisioned from a repository in 35 seconds, then deliberately broken by hand to measure what each layer of automation notices. Infrastructure drift was caught in 303 ms and file drift in 652 ms, while the same file change was invisible to the provisioning tool entirely — and a change nobody had declared was invisible to both, permanently. Includes the reconciliation run that reverted an operator's deliberate changes in four seconds.
Verdict Drift detection is not a property of a tool, it is a property of what was declared. The same change — a gateway's scan period going from 1000 ms to 250 ms — is invisible to the infrastructure layer and caught in 652 ms with an exact diff by the file layer, because one had been told about it and the other had not. A third class, an undeclared file added beside a managed one, is invisible to both and has no technical remedy. Separately, enabling reconciliation reverted two deliberate operator changes in 4 s, including a tag reading 'donotreboot', while leaving the one change that altered plant behaviour untouched — it reverts what is declared, which is not the same as what matters.
25 Aug 2026 · 8 min read
 Concluded
TimescaleDB on PostgreSQL 16 · estate_tag_history, 334,808 rows across 3 sites × 6 tags · deadband simulated in Python against stored values
What a deadband actually costs
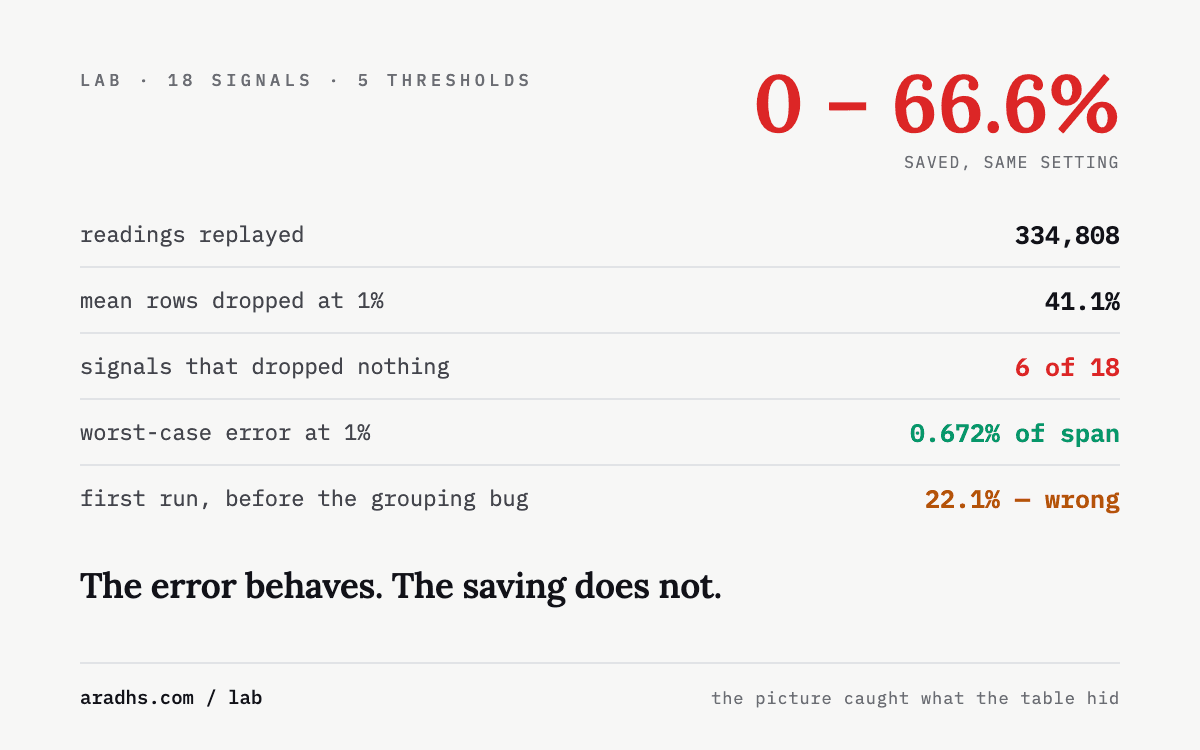
Eighteen signals from three sites, 335,000 stored readings, run through five deadband thresholds to measure retention against reconstruction error. At 1% the mean saving is 41.1% of rows for a mean worst-case error of 0.67% of span — but the per-signal range runs from 0.0% to 66.6%, so a global threshold is inert on a third of the tags. Includes the interleaving bug that made the first run's numbers meaningless.
Verdict A deadband threshold expressed as a percentage of span does not produce a predictable saving, because the saving depends on how far a signal travels between samples relative to its range, not on the threshold. Measured across 18 series at 1%: mean saving 41.1%, range 0.0%–66.6%, with six series dropping nothing at all. Error, by contrast, IS predictable and bounded — mean worst-case 0.672% of span at a 1% threshold. So the setting is safe and its benefit is unknowable without measuring per signal. Set it per tag against the smallest movement that matters, not globally against disk.
24 Aug 2026 · 4 min read
 Concluded
nmap 7.x SYN scan · Proxmox VE 9.1 · Ignition 8.3.8 file-based config · pve-firewall · 192.168.29.0/24 plant segment
Counting the plant three ways
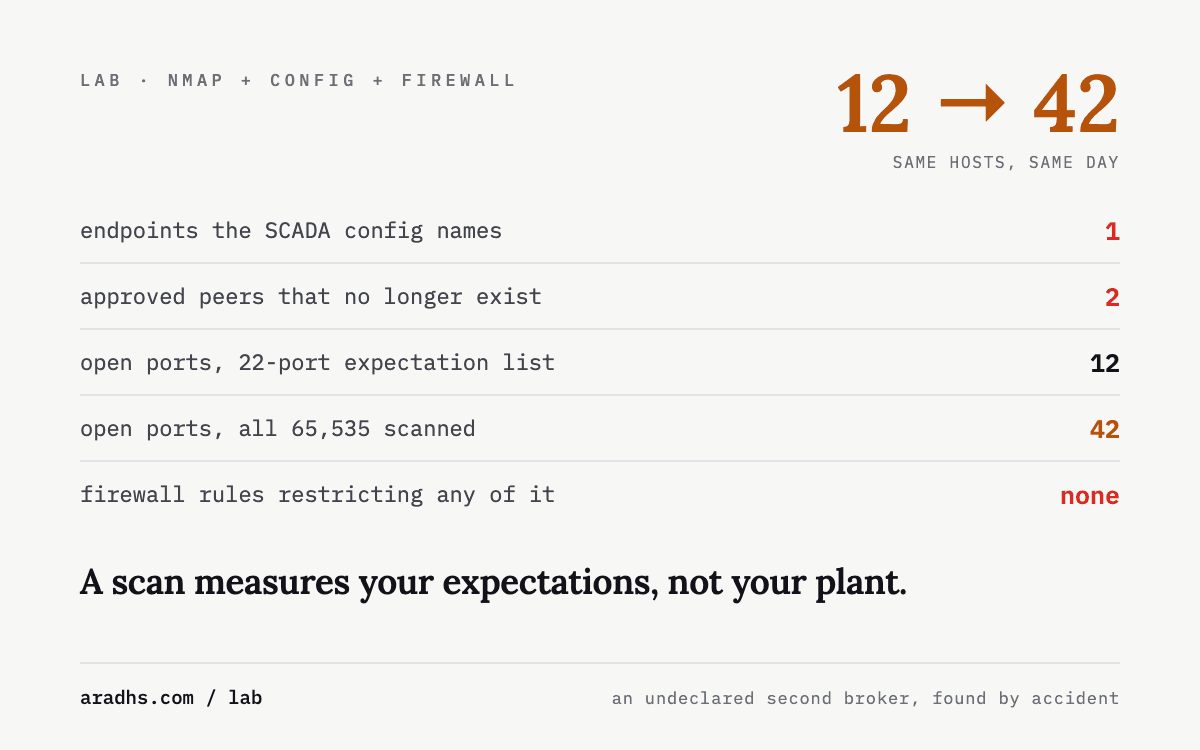
The same small estate inventoried from its control-system configuration, from a port scan, and from its firewall rules. The control system references one external endpoint and two peers that no longer exist. A 22-port scan finds 8 hosts and 16 open ports; removing the port list finds 42 open ports on five of them. The firewall permits everything. Three counts, three different plants.
Verdict An asset inventory taken any single way is wrong, and the three ways are wrong differently. Configuration under-reports catastrophically (1 endpoint against 42 open ports) and also carries ghosts — two gateway-network peers still marked Approved for machines that were destroyed. A port scan reports whatever its port list allows: 16 open ports with a sensible 22-port list, 42 with no list at all, on unchanged hosts. The firewall was disabled, which nothing in the other two inventories would have revealed. The deliverable is not any one list — it is the diff between them.
23 Aug 2026 · 4 min read
 Concluded
Ignition 8.3.8 pair + edge gateway · Event Streams → Redpanda v26.2.1 → Redpanda Connect 4.103.1 · python + paho-mqtt edge agent → EMQX 5 → Redpanda Connect · TimescaleDB pg16 · tcpdump on the estate bridge
Measuring which clock stamped each row, on two paths into the same historian
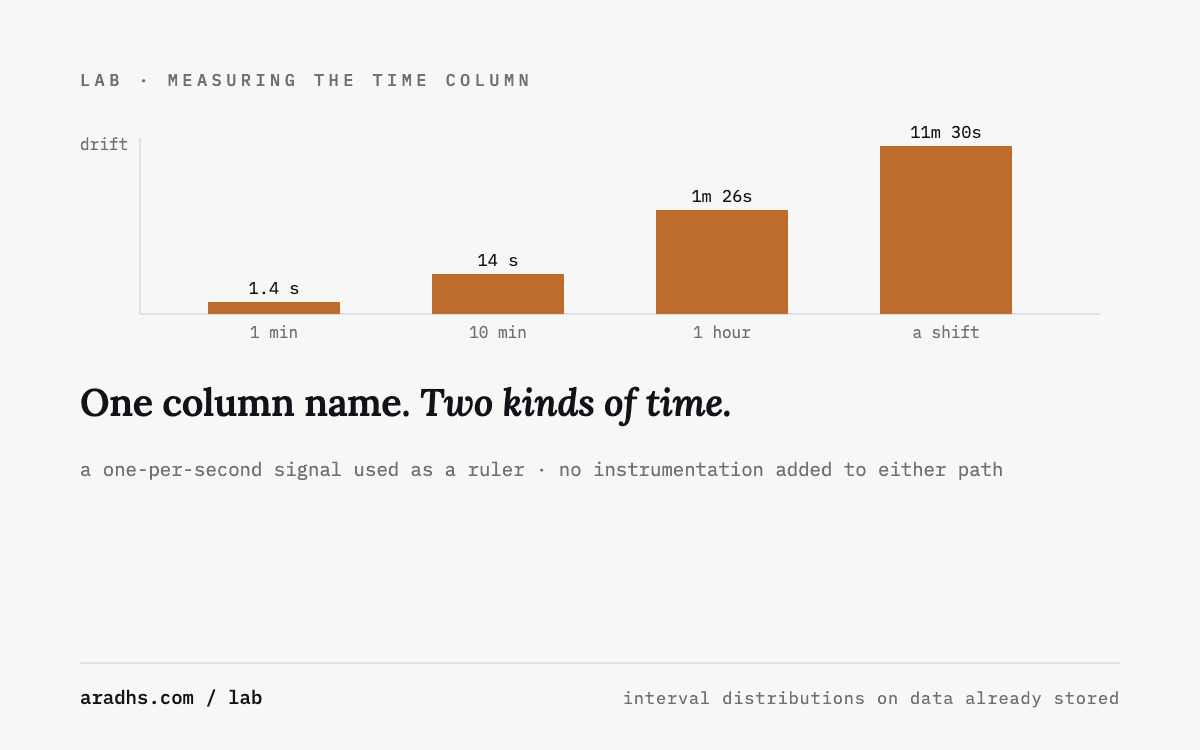
A one-per-second signal used as a ruler against two ingest paths on the same estate. One records intervals of exactly 1000 ms with zero variance; the other averages 1024 ms and never corrects, accumulating about 86 seconds of drift per hour. Both write to a column called ts. Includes the sampling loop that causes the drift, the interval distributions, and what a day of packet capture showed about time synchronisation on the plant equipment.
Verdict Two paths into one database record two different quantities in identically named columns. The licensed path carries the tag's own timestamp — consecutive intervals of a 1 Hz signal measure 1000 ms with a standard deviation of 0.0 ms, min and max both exactly 1000, which publish-time stamping cannot produce. The open path carries the collector's wall clock at sample time, averaging 1024 ms with 6.6 ms of variation, because its loop sleeps for a fixed period after doing work instead of scheduling against a deadline: a 2.4% slow rate that never self-corrects and accumulates ~86 s/hour. Neither table records ingest time alongside event time, and no column distinguishes the two kinds of timestamp, so any join across them silently compares plant time against collector time.
20 Aug 2026 · 4 min read
 Concluded
Ignition 8.3.8 redundant pair + edge gateway · Event Streams 1.3.8 · Kafka Connector 1.3.8 · Redpanda v26.2.1 ×3 · Redpanda Connect 4.103.1 · EMQX 5 · python + paho-mqtt edge agent · TimescaleDB pg16
Four paths into one historian, and what each one remembers about where the data came from
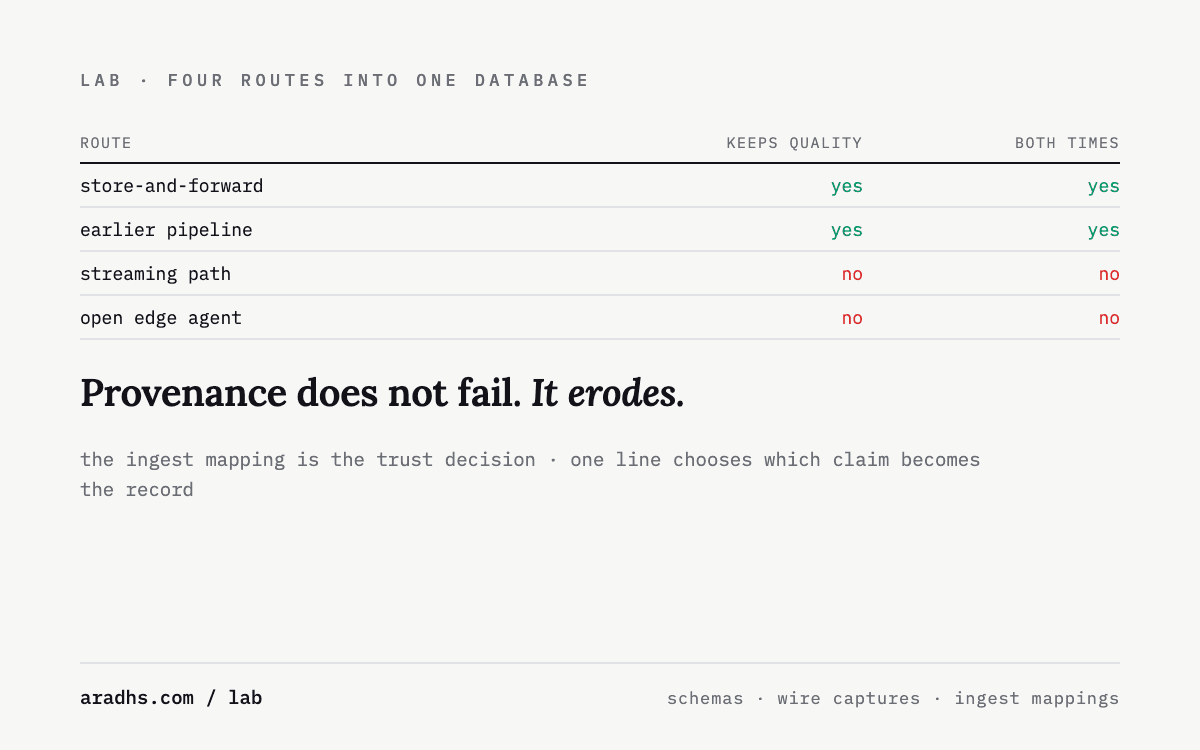
A three-site estate that writes into a single database by four different routes — a SCADA store-and-forward historian, a streaming pipeline, a broker-fed collector and an open-source edge agent. Comparing the schemas and the wire formats shows that provenance is not a property the plant has or lacks; it degrades path by path. Two of the four dropped quality entirely, and on one of them a published message's self-declared origin overwrites the address it arrived on.
Verdict Provenance degrades hop by hop and path by path, and the degradation is recorded nowhere. Of four routes into the same database, the two oldest preserve the instrument's quality code and distinguish event time from ingest time; the two newest carry neither, in tables whose columns are otherwise identical. On the open path the site is asserted twice per message — once in the topic, once in the payload — and the sink reads the payload, so a message's self-declaration silently overrides the address it was delivered on. No credential is required to publish one. Encryption is present on some links and is irrelevant to all of this: it authenticates the hop, never the reading.
19 Aug 2026 · 4 min read
 Concluded
Proxmox vmbr0 · tcpdump -s 96 · python flow aggregator (two schemas) · Ignition 8.3.8 ×5 · EMQX 5 · Redpanda ×3 · Redpanda Connect · TimescaleDB pg16 primary + replica
Twenty-one hours of plant traffic, and the segmentation policy it implies
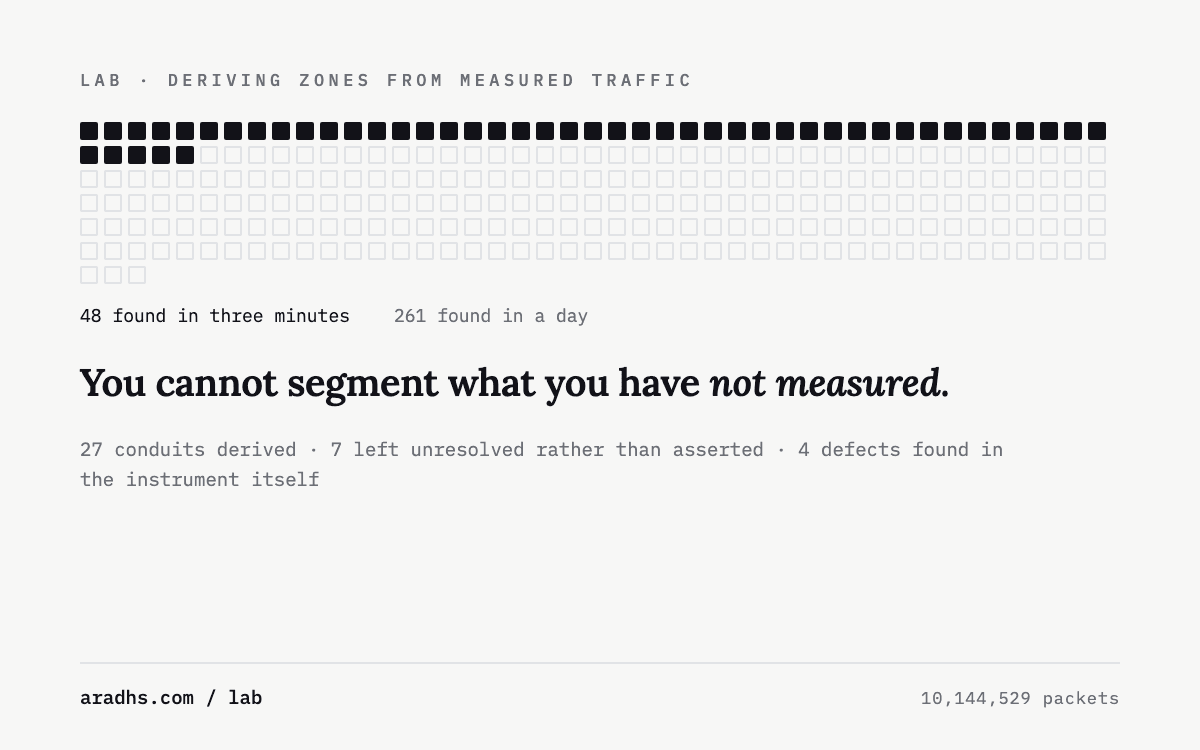
Before drawing a single zone I captured every flow on a running three-site estate for 21.8 hours, then derived the zones and conduits from the measurement instead of from a reference model. The policy that fell out disagrees with a Purdue-style model in twenty-two places, and agrees with it in one — which turned out to be the one conduit the plant never uses. Also recorded: the four defects I found in my own measuring instrument, two of which produced confident wrong answers.
Verdict Deriving segmentation from measured traffic and from a reference model produce materially different policies for the same plant: 22 conduits the plant needs that the model forbids, 1 the model requires that the plant never uses. The disagreement is not noise — the single 'required' conduit runs the opposite direction to the largest real flow in the estate, and the reason is redundancy behaviour rather than security. Two secondary findings matter as much: one host provably belongs to two zones at once, and the measurement window dominates the result (48 internal flows at three minutes, 261 at 9.6 hours). The instrument itself failed four times; three heuristics on the same dataset yielded 387, 45,376 and 18 conduits, and only recording source ports resolved it.
16 Aug 2026 · 6 min read
 Concluded
python + paho-mqtt edge agent with SQLite spool · EMQX 5 · Redpanda Connect 4.103.1 (mqtt input → sql_raw) · TimescaleDB pg16
A site with no SCADA: store-and-forward from an edge that costs nothing
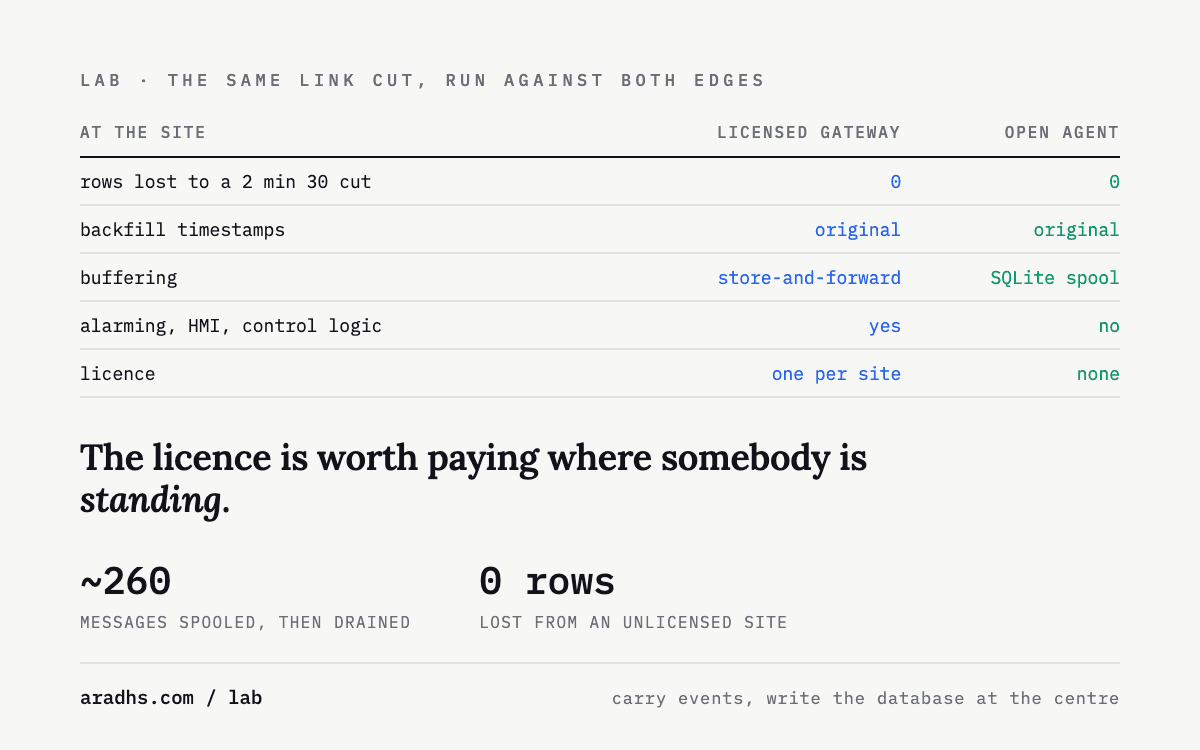
Half an estate has no operators, no screens and nothing to control — it only collects. Putting a SCADA licence at those sites buys a product to move bytes, and pointing a database connection across an unreliable link is the wrong transport regardless of vendor. This is the alternative, measured against the same link cut: a small publisher with a local disk queue, a broker, and the database written at the centre. Zero rows lost, zero licences.
Verdict The open path matches the licensed one where it counts: a two-and-a-half minute link cut cost zero rows, backfilled with original timestamps, from an edge with no SCADA product on it. The design rule that makes it work is that the WAN carries small events and the database write happens at the centre on a local network — the opposite of syncing a historian across the link. One run of this test was invalid and looked perfect, which is the more useful finding: a fault-injection test has to prove the fault was injected.
11 Aug 2026 · 5 min read
 Concluded
Ignition 8.3.8 ×5 (redundant pair + 3 edge sites) · Event Streams 1.3.8 · Kafka Connector 1.3.8 · Redpanda v26.2.1 ×3 RF-3 · Redpanda Connect 4.103.1 · TimescaleDB pg16 primary + streaming replica · HAProxy lts-alpine
Three sites into a redundant pair: a kill battery, and the one connection that pointed the wrong way
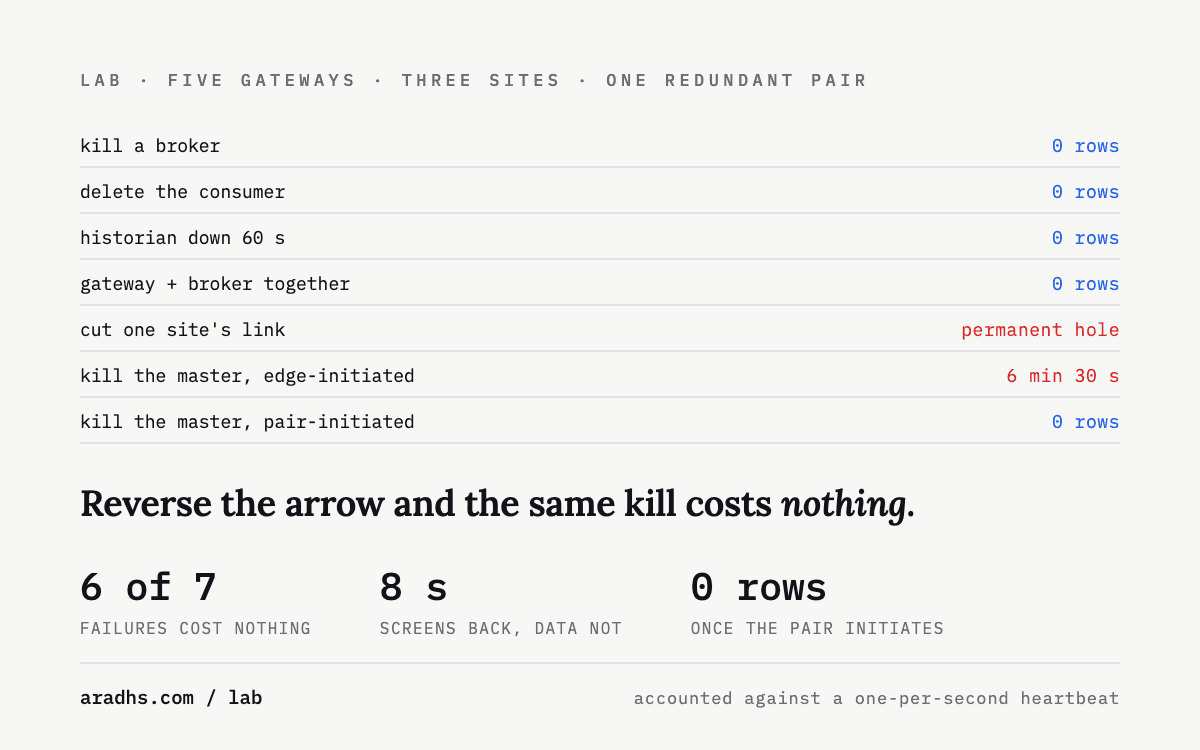
Five gateways, three sites, a redundant central pair, and a streaming historian with a hot standby — then seven deliberate failures, each accounted against a one-per-second heartbeat. Six of the seven cost nothing. The seventh cost six and a half minutes of estate-wide data, and the cause was not a missing feature: it was the direction a Gateway Network connection had been opened. Reverse the arrow and the same kill costs zero rows.
Verdict Everything downstream of the first hop forgives you: broker kill, consumer kill, a sixty-second historian outage, and a simultaneous gateway-plus-broker loss each cost exactly zero rows. Two things do not. A site WAN cut is a permanent hole in a live tag mount, because a subscription has no memory — closing it needs a durable write at the site, which store-and-forward then backfills with original timestamps. And a redundant master pair only protects the data path if the edge connections were opened *by* the pair; open them from the edge instead and failover moves your screens in eight seconds while the data stops until someone notices.
10 Aug 2026 · 8 min read
 Concluded
Ignition 8.3.8 · Event Streams 1.3.8 · Redpanda v26.2.1 × 3 (StatefulSet, RF3) · Redpanda Connect 4.103.1 · TimescaleDB pg16 · k3s
Event Streams to TimescaleDB: the config recipe, five silent failures, and a loss-accounted kill battery
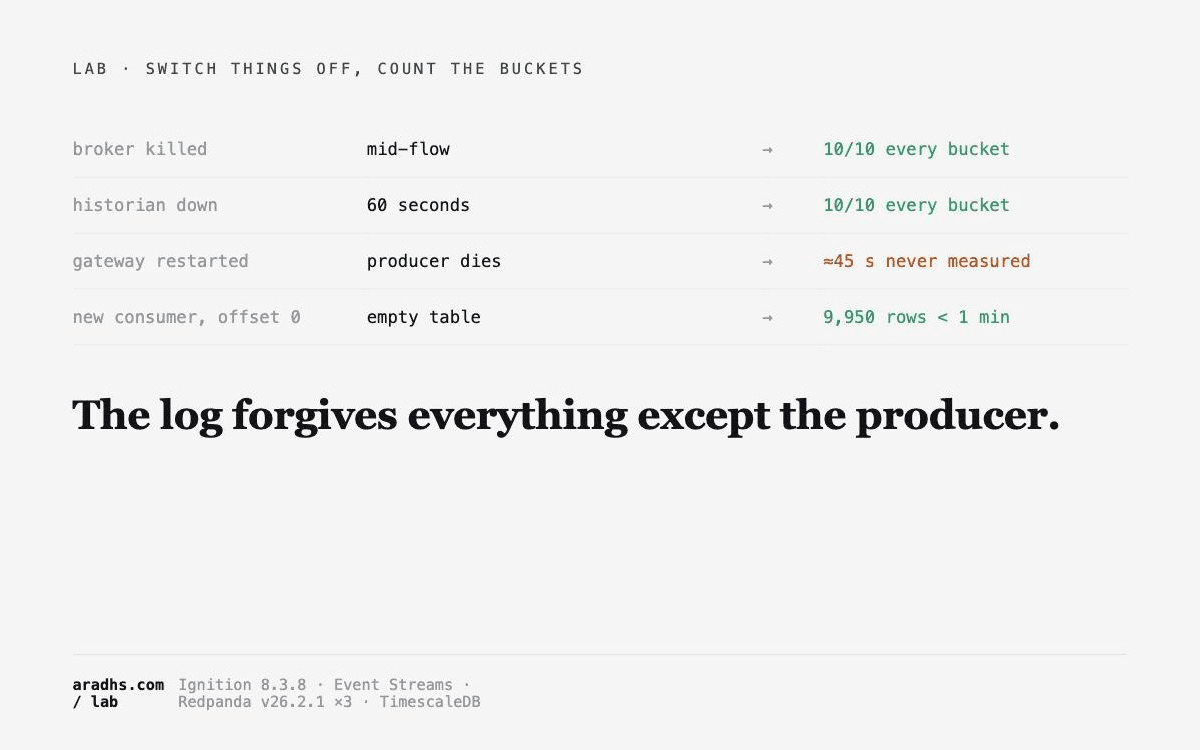
The sequel rig to Ignition-and-Redpanda-on-k3s: this time data flows. Live tag changes keyed by tag path through a 3-broker Redpanda v26.2.1 cluster into a TimescaleDB hypertable, with the whole producer configured as JSON files in the project. Getting there surfaced five ways Event Streams fails silently, and the undocumented config shapes are written down here so nobody has to disassemble module jars again. Then the kill battery: broker, database, gateway, each loss-accounted against a 1 Hz heartbeat.
Verdict The pipeline works and survives everything except producer death: broker kill and a 60 s database outage cost zero rows (10/10 heartbeat ticks in every bucket), a gateway restart cost ~45 s of unmeasured plant. End-to-end latency p50 650 ms, p95 5.3 s with deliberate 5 s batching. But the road there is paved with silent failures: handler type IDs must match bytecode exactly, five config fields are mandatory and NPE individually, expression-typed fields swallow bare strings, IGNORE eats delivery errors while reporting GOOD, and a malformed handler makes a stream vanish without a log line. Config changes need two file-scan cycles: the first only shuts the old stream down.
7 Aug 2026 · 5 min read
 Concluded
tcpdump 4.99.4 · tshark 4.6.7 · eclipse-mosquitto 2.0.22 · Modbus TCP · EtherNet/IP · S7comm · MQTT · OPC UA
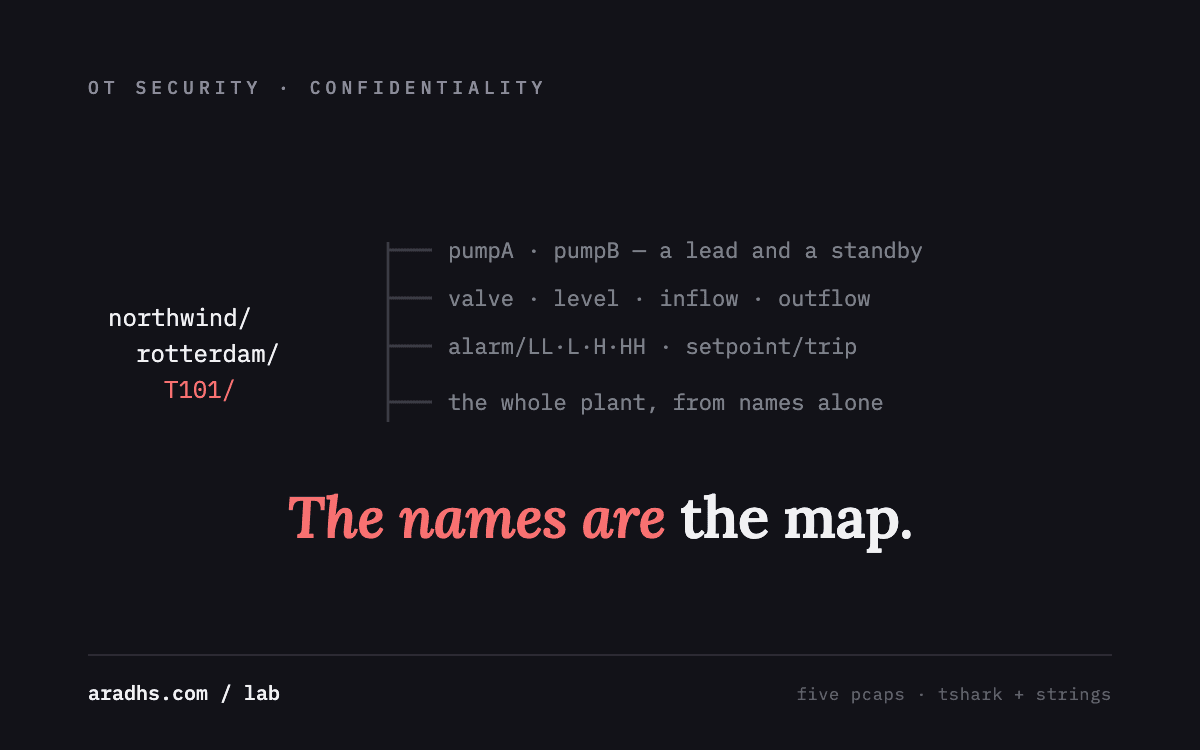
Reading a plant from its names: what vocabulary five protocols leak
The rest of this series watched people write to plants they did not own. This one watches somebody read, and only read. Five captures, ranked by how much of the plant a passive tap can rebuild from names alone — and the ranking runs opposite to the write risk.
Verdict Confidentiality is usually explained as someone reading your values. The larger loss is someone reading your vocabulary. Modbus, the protocol that accepts any write, leaks the least because it has no names; OPC UA and a Unified Namespace leak the most because they are built to describe themselves. Legibility is the confidentiality liability, and the fix is to encrypt the transport, never to obscure the names.
6 Aug 2026 · 6 min read
 Concluded
k3s v1.31.5 · Ignition 8.3.8 · Redpanda v24.2.18 · StatefulSets + local-path PVCs · Proxmox LXC
Ignition and Redpanda on the same cluster, and the module that deletes the bridge
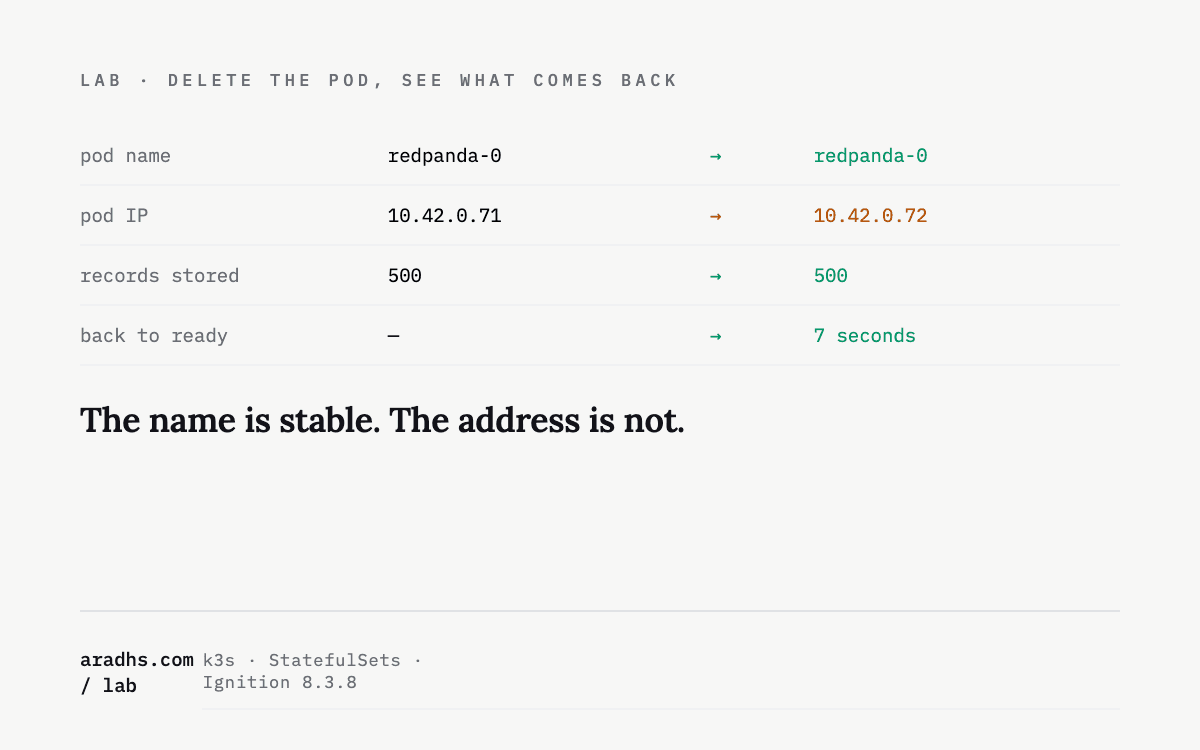
Both as StatefulSets on k3s, then both pods deleted outright. Redpanda returned in 7 seconds with all 500 records intact; the Ignition gateway in 16, answering HTTP. Kubernetes kept every promise, which was the least interesting finding. The interesting one was in the gateway's module folder: Ignition 8.3 ships a Kafka connector and an Event Streams module, so the bridge in the middle of the usual drawing is no longer required.
Verdict Kubernetes did exactly what it advertises and that is the boring, correct result — both pods came back with their names and their data in under twenty seconds, unattended, and 500 of 500 records survived a pod deletion. Two things are worth carrying out: both pods returned on new IPs with unchanged names, so address by DNS name and never by address; and Ignition 8.3 ships Kafka Connector and Event Streams modules in the box, which removes the protocol-translation bridge most architecture drawings still contain.
6 Aug 2026 · 4 min read
 Concluded
tcpdump 4.99.4 · tshark 4.6.7 · eclipse-mosquitto 2.0.22 · Modbus TCP · EtherNet/IP · S7comm · MQTT · OPC UA
Scoring five industrial protocols against the 62443 foundational requirements
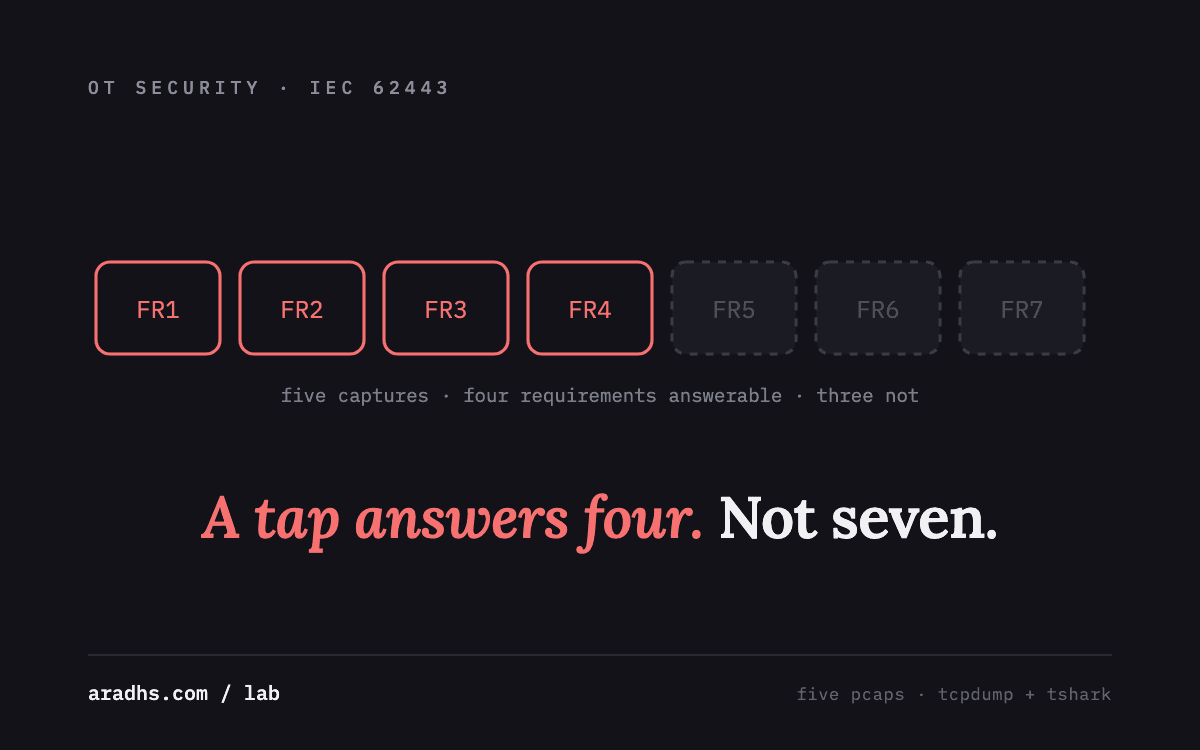
Five packet captures from four earlier labs, scored against the seven foundational requirements of IEC 62443. The result is four of seven: a passive capture is evidence for identification, use control, integrity and confidentiality, and is evidence for nothing at all about the other three.
Verdict A packet capture can honestly answer four of the seven foundational requirements and no more. Identification, use control, system integrity and data confidentiality are all readable off the wire. Restricted data flow is a property of the network drawing, timely response to events is out of band, and resource availability needs a load test that was never run here. The three a capture cannot reach are the three that would have stopped every finding below, which is a reasonable explanation for why the standard puts its weight on systems rather than wire formats.
6 Aug 2026 · 6 min read
 Concluded
Mosquitto 2 · MQTT · JSON Schema (Ajv) · Node.js 20 · Docker Compose · Proxmox LXC
A Unified Namespace built from parts, to find out which part is the product
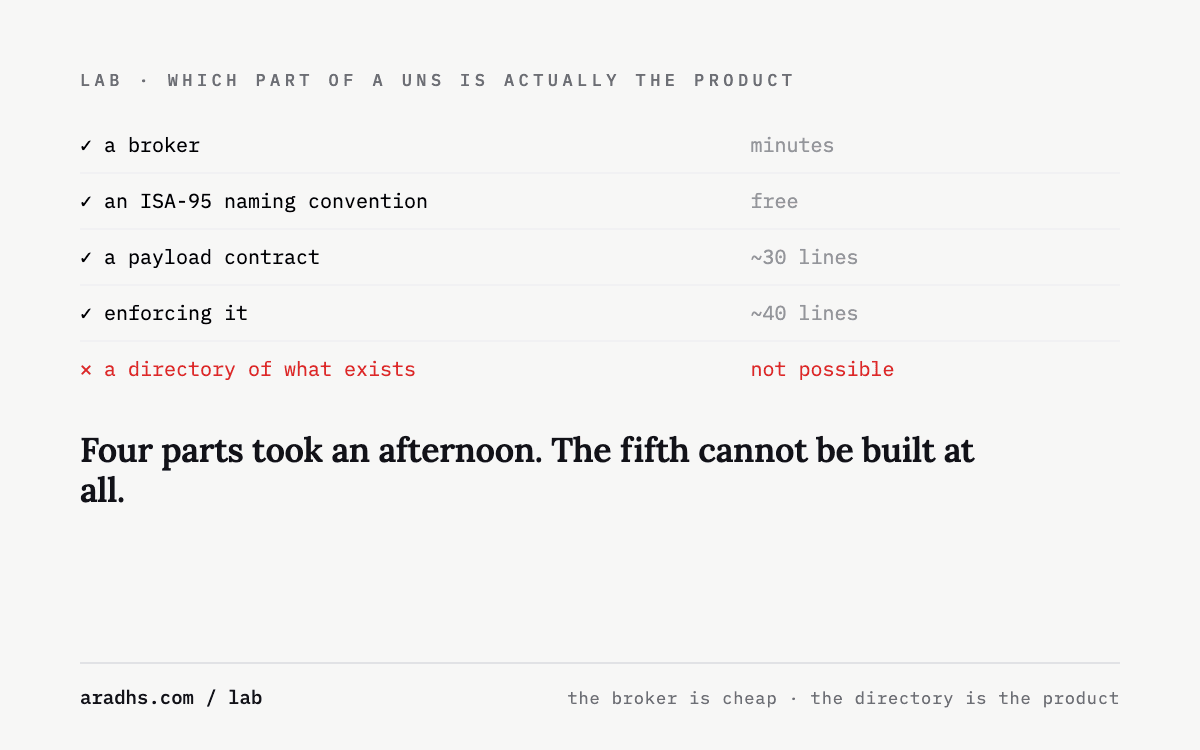
Mosquitto, an ISA-95 topic convention, a JSON Schema payload contract and a validator — 144 tags across three sites running in 2.36 MiB. Then two tests. Discovery by listening found 96 of 144 tags in three minutes and never found the rest, because they were the event-driven ones. And of 239 deliberately malformed messages, the broker accepted 239 and objected to none.
Verdict Four of the five parts of a Unified Namespace are an afternoon's work and run in 2.36 MiB: the broker, the naming convention, the payload contract, and enforcement of it — which caught 239 of 239 injected defects. The fifth cannot be built by listening at all. A consumer subscribed to the whole namespace found 96 of 144 tags in three minutes and would never find the other 48, because they only publish when something goes wrong. A UNS is not a broker with tidy topic names; it is a directory plus a contract plus enforcement, and the directory is the part you are actually buying.
5 Aug 2026 · 5 min read
 Concluded
Redpanda Connect 4.102.0 · Node-RED 4.0.9 · Mosquitto 2 · TimescaleDB pg17 · Docker Compose · Proxmox LXC
The same plant pipeline, built twice: Node-RED against Redpanda Connect
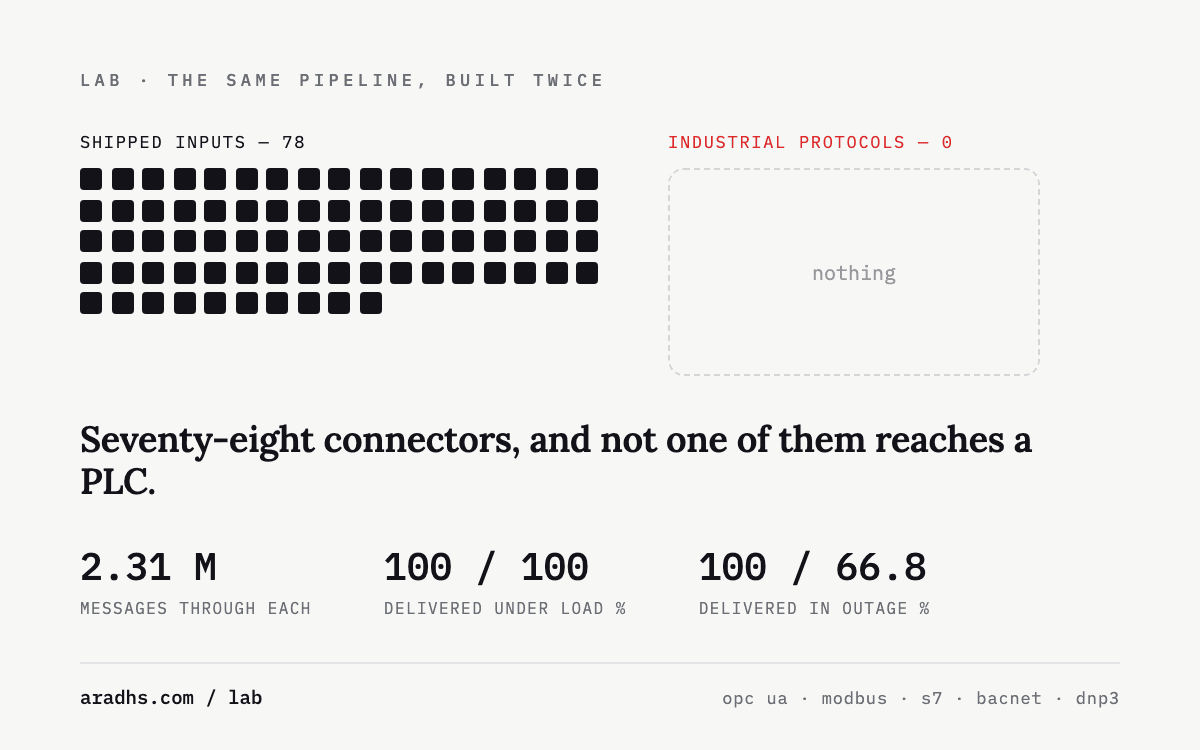
Two pipelines doing an identical job — MQTT in, asset context, unit conversion, batch, insert — fed from one broker and measured against per-site sequence numbers so loss was arithmetic rather than estimation. 2.31 million messages through each at rates up to 19,894 a second. Both delivered everything. Then I stopped the database for sixty seconds and one of them lost a third of the stream. Three of my own harness bugs had to be fixed first, and two of them would have produced confident, wrong numbers.
Verdict The throughput argument for replacing Node-RED is fiction at plant scale — both pipelines delivered 100% of 2.31 million messages at every rate up to 19,894/s, and Node-RED's worst lag was lower at five of six steps. The argument that survives is durability: when the database went down for sixty seconds, Connect landed 100% and Node-RED lost 119,500 readings, because one acknowledges after the insert commits and the other on receipt. But Connect ships 78 inputs and not one industrial protocol, so it cannot replace the half of the job that touches a PLC. Keep Node-RED on acquisition, put Connect downstream of the broker.
4 Aug 2026 · 9 min read
 Concluded
Redpanda v24.2.18 (single node, 2 cores, 2 GB) · kafkajs · Docker Compose · Proxmox LXC
A hundred remote sites into one broker, and the measurement that reversed itself
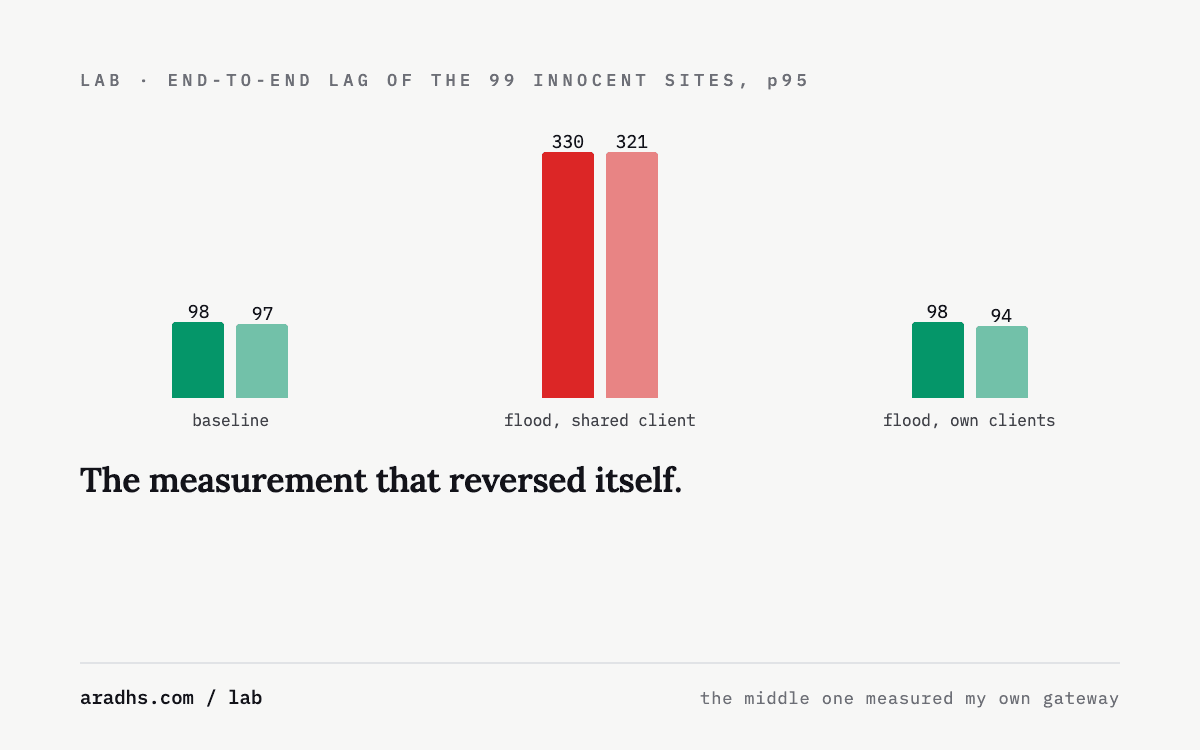
One Redpanda node with two cores carried a hundred simulated SCADA sites at 4,797 messages a second with zero errors and 98 ms from site to centre. The interesting part was the isolation test: run through a shared client, one flooding site appeared to slow every other site by 3.4×; run with its own connection, the other ninety-nine were completely unaffected. The first result measured my own gateway. Also: a consumer subscribed to per-site topics by pattern received zero messages, because the topics were created after it subscribed.
Verdict Capacity is not the constraint at a hundred sites — a two-core broker carried the estate at 4,797 msg/s with zero errors and 98 ms end-to-end, and sustained 14,447 msg/s with one site flooding at 200×. Isolation is real but it follows the connection, not the cluster: sites on their own connections were completely unaffected by a flooding neighbour, while sites sharing one client queued behind it before the broker was involved. Prefer one topic partitioned by site — a topic per site costs 2.8× publish tail latency and, worse, leaves new sites invisible to a pattern-subscribed consumer.
3 Aug 2026 · 5 min read
 Concluded
UMH Core 0.44 · Redpanda · Benthos-UMH · MQTT · Modbus TCP · TimescaleDB · MCP streamable HTTP · Docker Compose
I gave Claude a Unified Namespace. It knew everything and understood nothing.
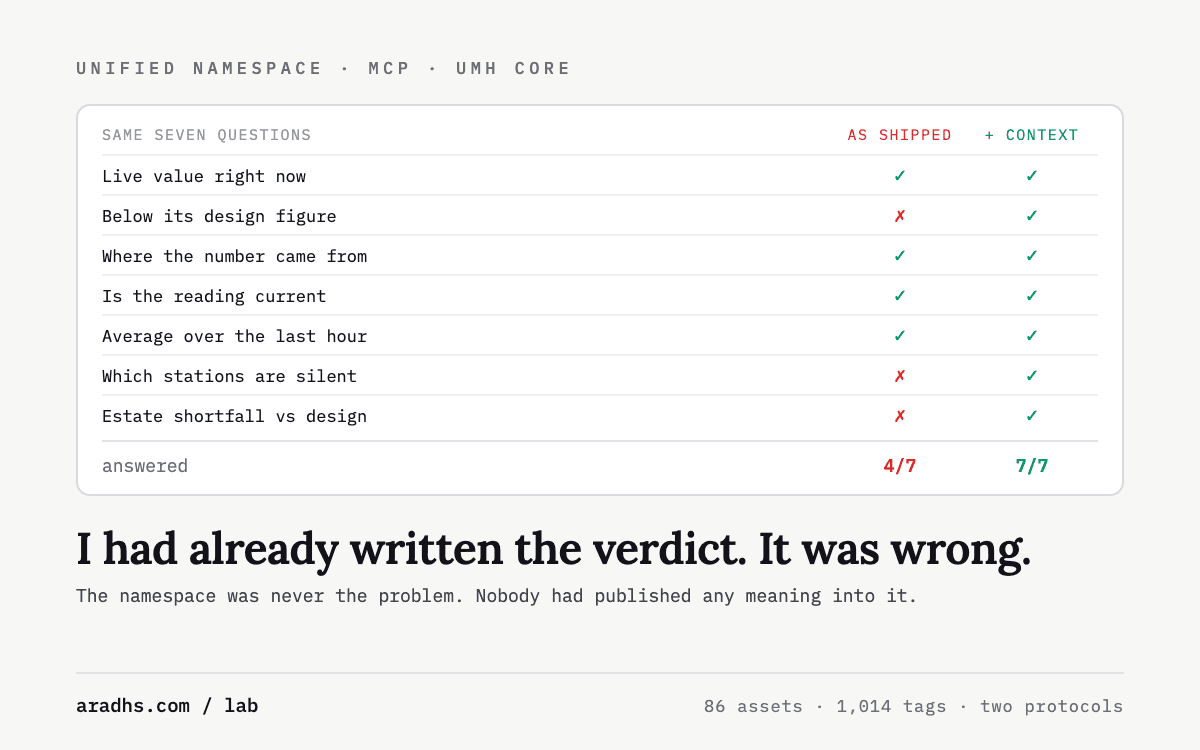
UMH Core ships with no AI surface at all, so I built one: an MCP server over a live Unified Namespace carrying 83 district-cooling stations and two Modbus devices. Then I ran it head to head against a copilot reading the same estate at the same instant, seven questions each. The namespace answered four. The three it failed all had the same shape, and fixing them turned out not to be a limit of the architecture.
Verdict A Unified Namespace gives a model reach that a hand-built tag layer cannot match — 1,014 tags across 86 assets and two protocols, none of them declared anywhere. It gives it no judgement whatsoever until somebody publishes design context onto the wire alongside the measurements, at which point the same generic tools beat the specialised ones because they also cover the assets nobody wrote a profile for. Publish context as data, convert units at the point of entry, and put the direction of every limit in its name.
2 Aug 2026 · 6 min read
 Concluded
HighByte Intelligence Hub 4.4.4 · OPC UA · Ignition 8.3 · TimescaleDB · MQTT · MCP · Docker
Does your plant need a whole layer just for context? I tested HighByte to find out
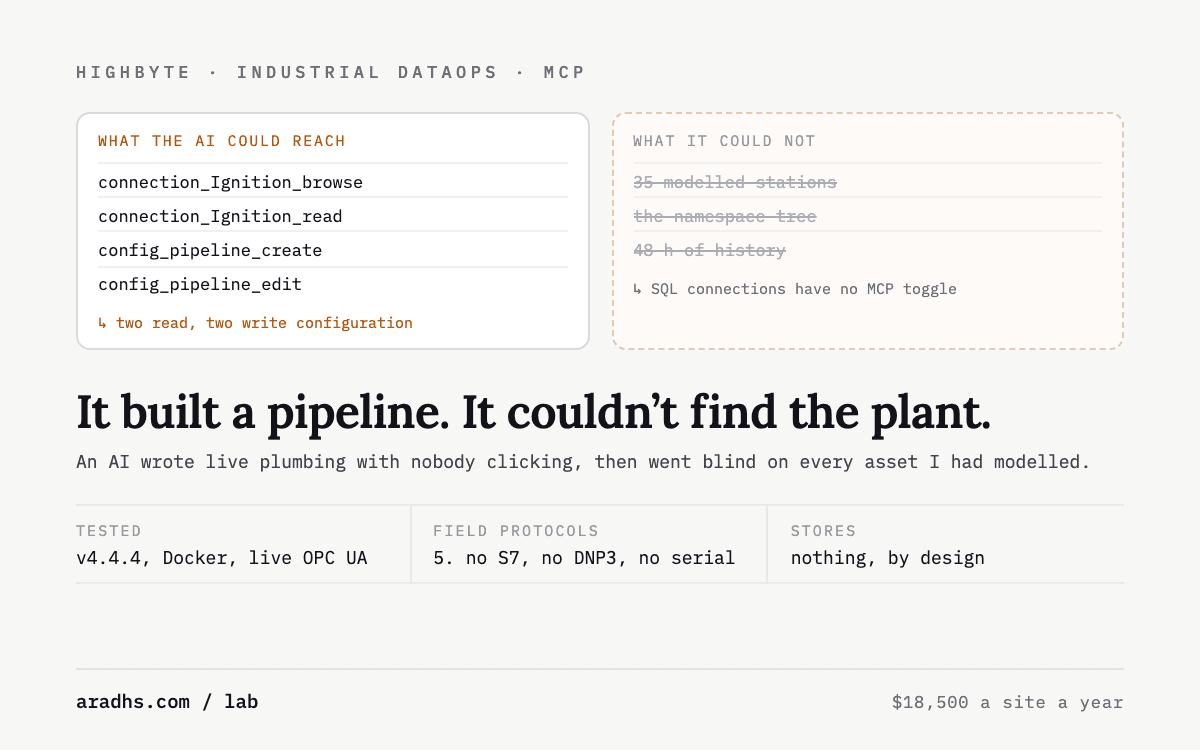
HighByte Intelligence Hub 4.4.4 against a live OPC UA source and a real historian, to answer one question: is a dedicated layer just for making plant data meaningful worth $18,500 a site a year, or does the kit you already own do the same job? An AI built a working pipeline on the canvas without a human clicking anything, which is a genuine first for an industrial product. The same client could not answer the simplest question about the plant, because the models, the namespace and the historian are not on that surface at all.
Verdict Worth it if you run several sites and something downstream is already waiting for the data. Not worth it for one plant, where you own most of it already. The AI write-surface is the most interesting capability in an industrial product this year and I would leave it switched off until the audit log can name which pipelines a human actually wrote.
1 Aug 2026 · 14 min read
 Concluded
ClickHouse 24.8 · TimescaleDB pg17 · Docker Compose · Proxmox LXC
ClickHouse against TimescaleDB, ten million readings, same file into both
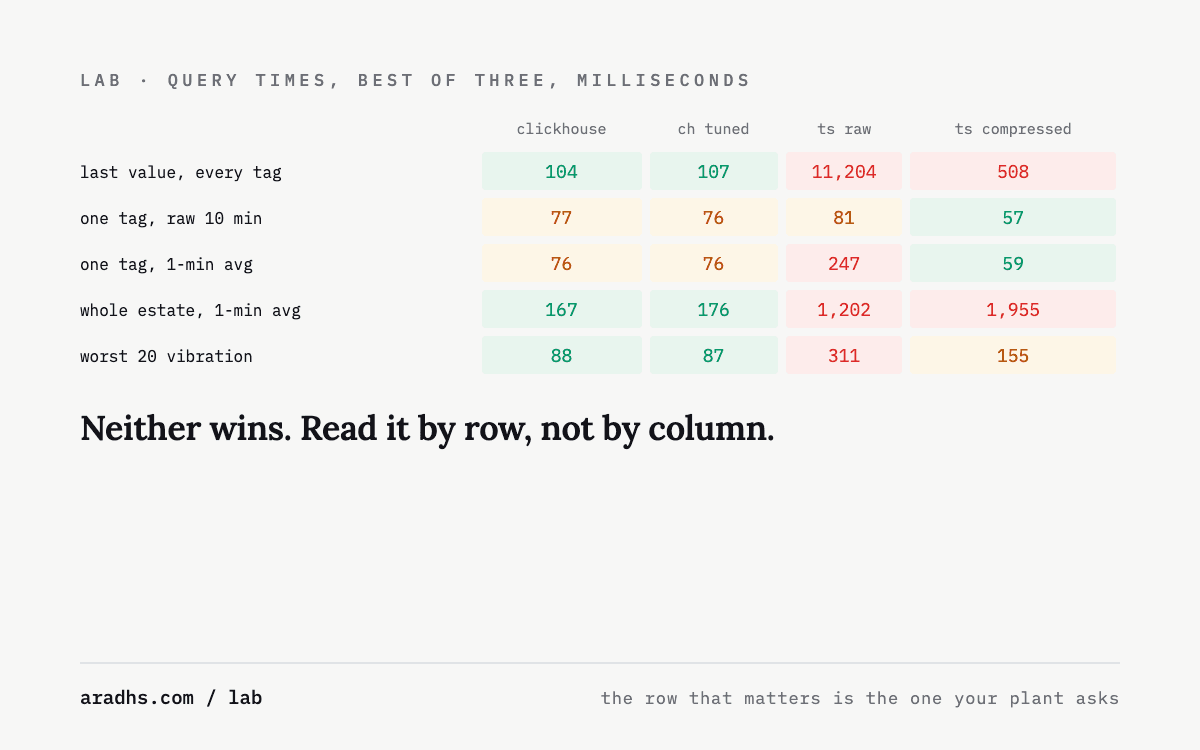
Both engines loaded from one generated file so no loader could favour either, then measured on the five query shapes a historian actually gets asked. ClickHouse loaded 11× faster and answered estate-wide questions in a fraction of the time; compressed TimescaleDB was faster on single-tag reads, which is what operators do all day. The finding that outranks the contest: ClickHouse's default compression codec wastes 6.6× the disk, at no cost in query speed, and nothing warns you.
Verdict No clean winner. ClickHouse loads 11× faster (3.75s vs 41.2s), stores 2.5× smaller once its codecs are set, and is 5–108× quicker on questions that sweep the whole estate. Compressed TimescaleDB is faster on single-tag reads (57ms vs 77ms) and is still Postgres, which is worth more in practice than any timing here. The measurement that should change behaviour either way: ClickHouse's default LZ4 codec uses 41.8 MB where time-series codecs use 6.35 MB for identical rows and identical query times.
1 Aug 2026 · 5 min read
 Concluded
Node.js 20 · TimescaleDB pg17 · Mosquitto 2 · Docker Compose · Proxmox LXC
Ten million plant readings on one small box, and the mistake that cost 5.6×
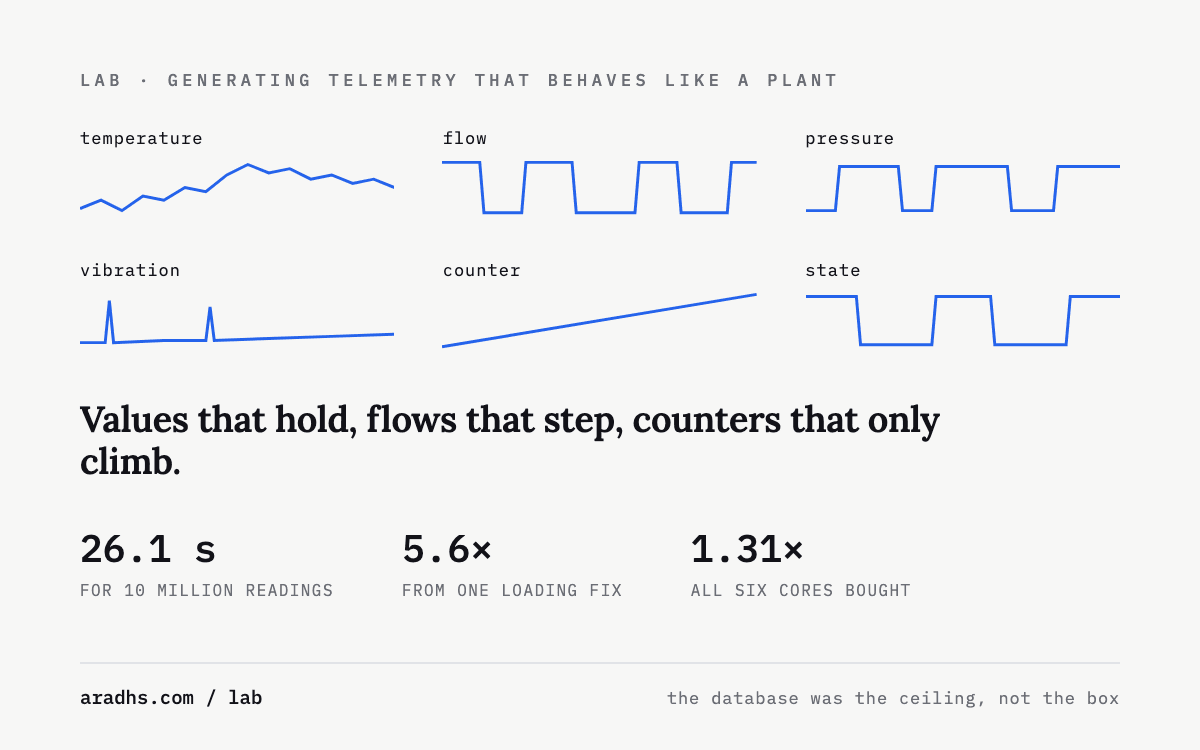
A generator that produces telemetry shaped like a plant rather than noise — values that hold, flows that step, counters that only climb — then ten million of them landed in a historian in 26 seconds. Two findings worth the afternoon: writing COPY a row at a time made it three times slower than plain batched inserts, and benchmarking compression against random numbers understates it by five times, which is the difference between sizing a disk correctly and buying five times too much.
Verdict Generating plant telemetry is not a hardware problem — one core makes 3.1 million readings a second, and ten million landed in 26.1 seconds on a small shared box. Two things are worth getting right. Write to the database in chunks rather than row by row, which was worth 5.6× and had nothing to do with the database. And make the data behave like a plant: shaped data compressed 43× where uniform random numbers managed 8.5×, so a noise-based load test will tell you to buy five times the disk you need.
31 Jul 2026 · 5 min read
 Concluded
Node-RED 4.0 · node-red-contrib-modbus 5 · MCP streamable HTTP · Docker Compose · modbus-serial
I gave Claude a live Modbus device
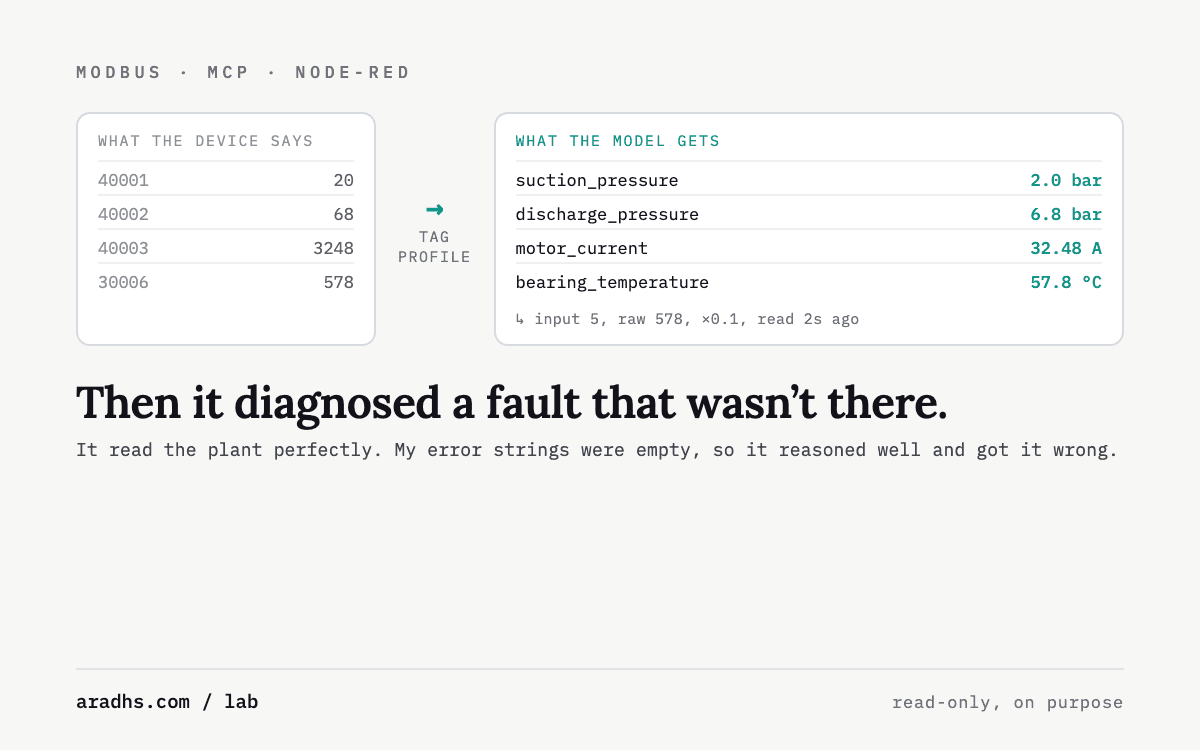
Two simulated devices, Node-RED doing the acquisition, and an MCP server handing the values to Claude by name instead of by register number. It answered well, refused to write a setpoint for the right reasons, and then confidently diagnosed a fault that did not exist — because the error strings I gave it were empty. The useful finding is not that the copilot worked. It is what happened to a competent analyst when the provenance underneath it was poor.
Verdict Putting a plant behind an LLM is a two-hour job and mostly worthless, because the model gets register numbers and no meaning. Adding a tag layer with units, scaling and provenance is what makes it useful, and read-only is what makes it installable. The finding worth keeping: when a block read failed and my code dropped the exception code, Claude reasoned carefully from an empty error string and reached a plausible, wrong conclusion. Bad provenance does not produce obvious nonsense. It produces confident, well-argued errors.
31 Jul 2026 · 9 min read
 Concluded
FUXA 1.3.3 · Node-RED 4.1 · Mosquitto 2.0.22 · Docker · generated project via REST
A complete SCADA system for nothing, and what that says about where the money was
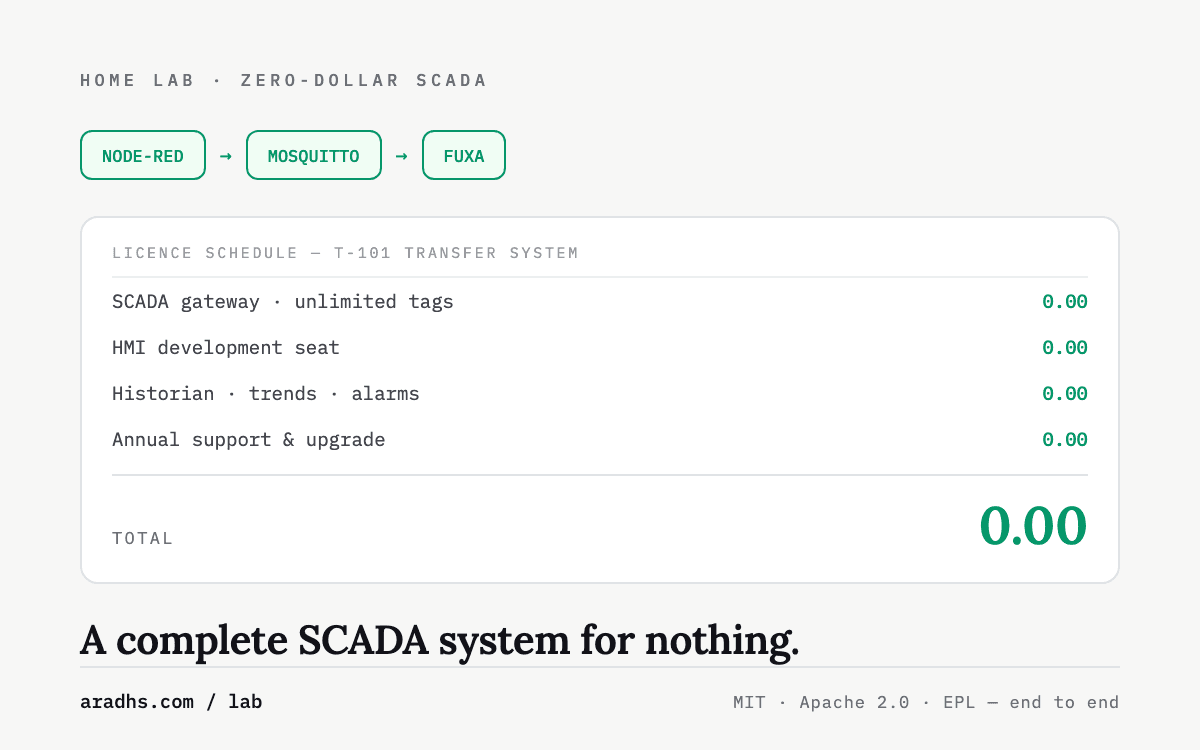
I built a working SCADA stack — mimic, alarms, historian, trends, writeback — out of FUXA, Node-RED and Mosquitto, driving it from a real pump and tank model rather than a sine wave. Total licence cost zero. The screen was never drawn: three hundred lines of Python generate the whole HMI and post it over an API. Six things about FUXA's project format that are not in its documentation cost me most of the build, including one that silently binds nothing.
Verdict The free stack is real. Mimic, alarms, historian, trends and writeback all work, and the licence file does not exist. Two caveats an OT engineer should weigh: FUXA has no redundancy story and no meaningful audit trail, so it belongs on monitoring and small standalone plants rather than anything with a safety case. And the documentation will not get you there — every load-bearing fact in this build came from reading the shipped source, not the docs.
30 Jul 2026 · 11 min read
 Concluded
Node-RED 4.1 · Sparkplug B · EMQX 5.10 · Ignition 8.3 · MQTT Engine 5.0 · k3s
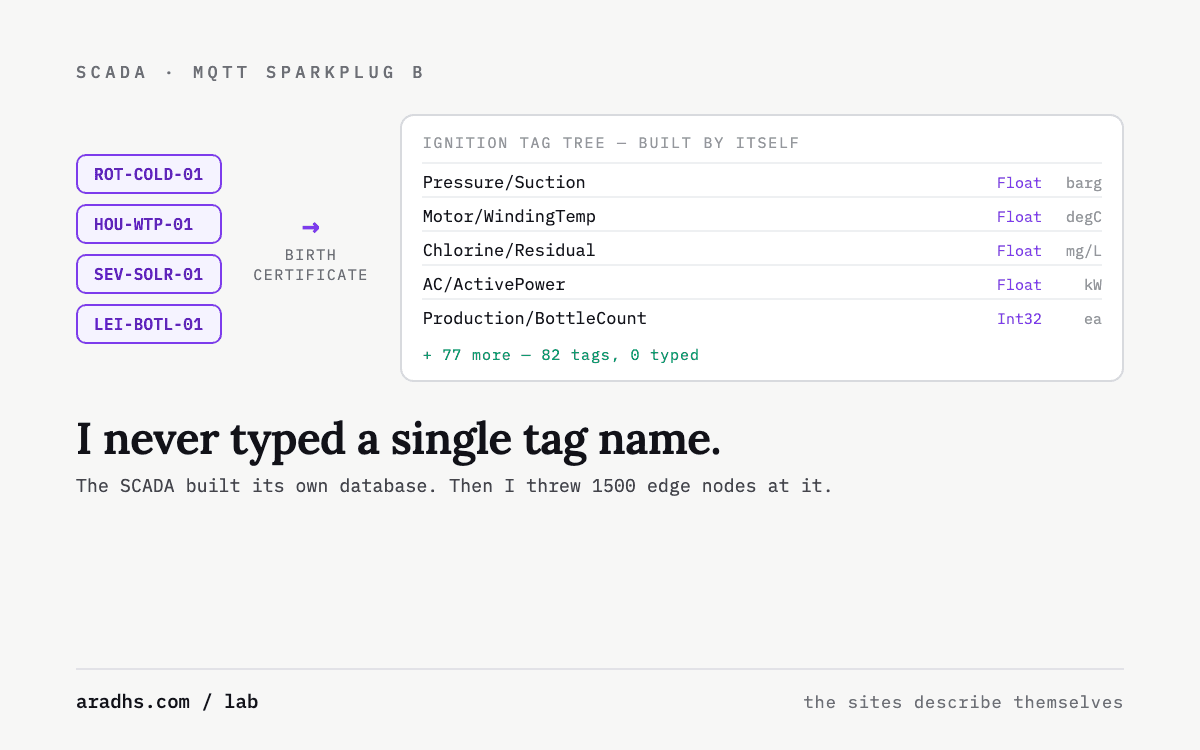
I never typed a single tag name: the SCADA built its own database
I stood up four Node-RED edge nodes publishing simulated plant data over MQTT Sparkplug B, pointed Ignition 8.3 at them as the consumer, then scaled the same rig to 1500 edge nodes to find out where it breaks. Every tag self-created. Device death detected in a quarter of a second. Report-by-exception cut wire traffic 2.6 times. Along the way: three genuine interoperability bugs between two mature implementations of the same spec, a gateway strangled by its own container limits, and two conclusions I had to retract after checking.
Verdict The self-describing payload is the real product and it delivers: eighty-two tags appeared in Ignition without anyone opening a tag editor, and five hundred edge nodes on one gateway is comfortable. But two independent implementations of a published spec disagreed in three places, every one failing silently or in a loop, and at fifteen hundred nodes the pair desynchronised into a rebirth storm I could not settle. Test the exact pair you intend to run, at the scale you intend to run it, before you drive to site.
29 Jul 2026 · 26 min read
 Concluded
Ignition 8.3 · k3s · Kubernetes · Python · Proxmox LXC
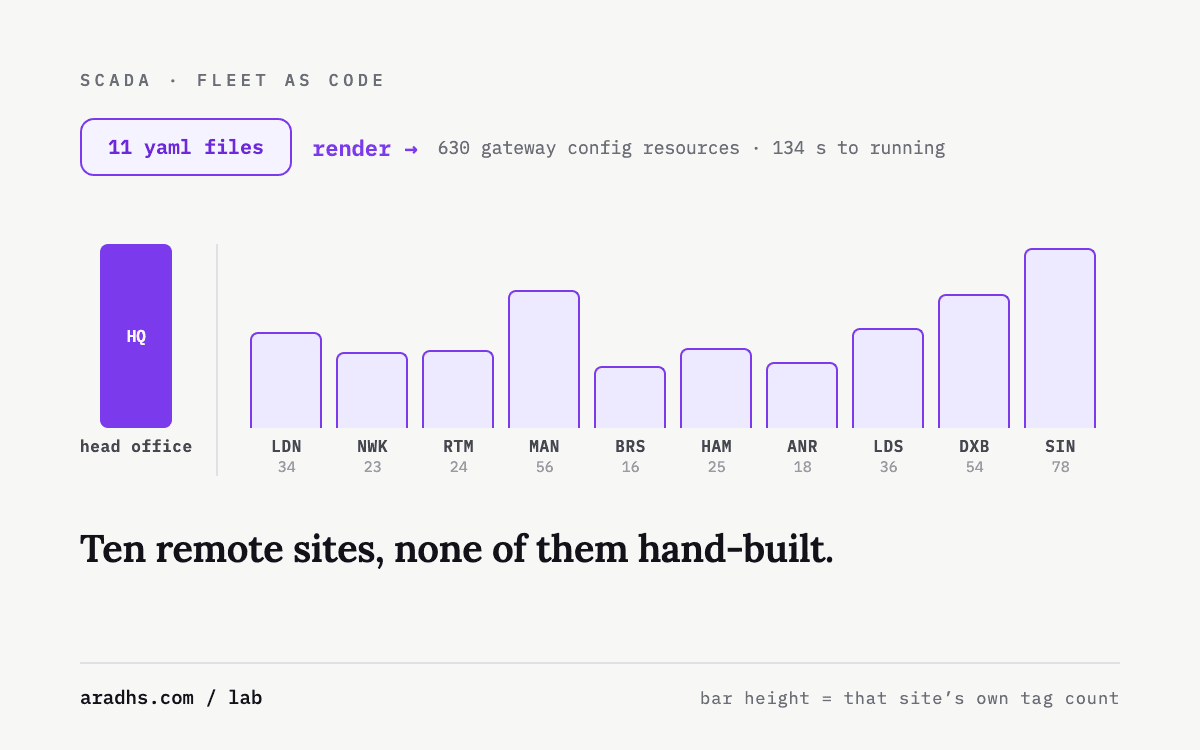
Ten remote SCADA sites from one repository
I built a head-office Ignition gateway and ten site gateways in a home lab, all generated from YAML — different equipment per site, real tags, real simulated IO. Eleven gateways from an empty cluster in 134 seconds, a destroyed site rebuilt from git in 60, and one honest wall I could not automate past.
Verdict The configuration genuinely generates — 630 resources across eleven gateways, from eleven small YAML files. What does not generate is trust: certificates and API tokens are the bootstrap problem nobody writes about, and they are what stands between this and a real multi-site rollout.
28 Jul 2026 · 13 min read
 Concluded
N3uron 1.22 · Ignition 8.3 · OPC UA · Docker · MCP
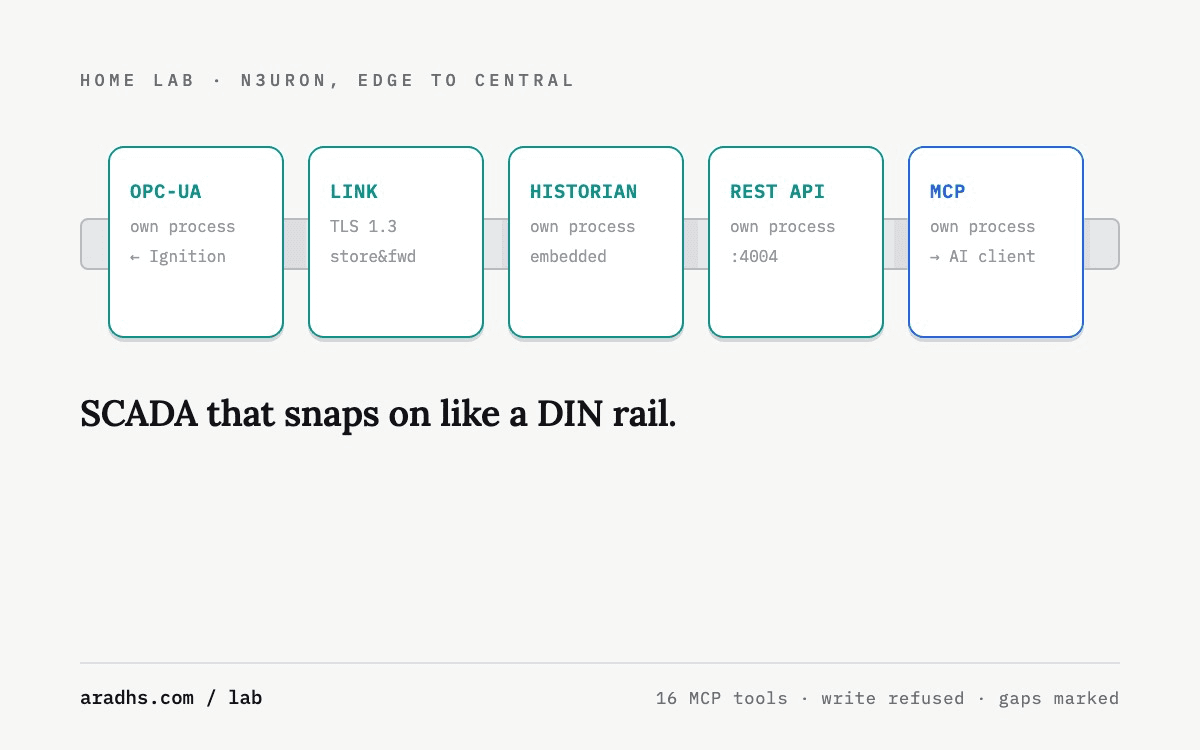
N3uron, edge to central: SCADA plumbing that snaps together like a DIN rail
I built a full edge-to-central N3uron system in my home lab — fed by a real Ignition gateway, linked over TLS with store-and-forward, historizing centrally, and serving data out over REST and a native MCP server that let an AI client browse live tags. Real setup, real gotchas, honest verdict.
Verdict Not an HMI and not trying to be one. As the data backbone between plant and IT it's the cleanest architecture I've run — and its MCP server is the first honest, permissioned bridge from OT data to AI assistants I've seen shipped in an industrial product.
27 Jul 2026 · 15 min read
 Concluded
Ignition 8.3 · k3s · Kubernetes · Proxmox LXC · PostgreSQL
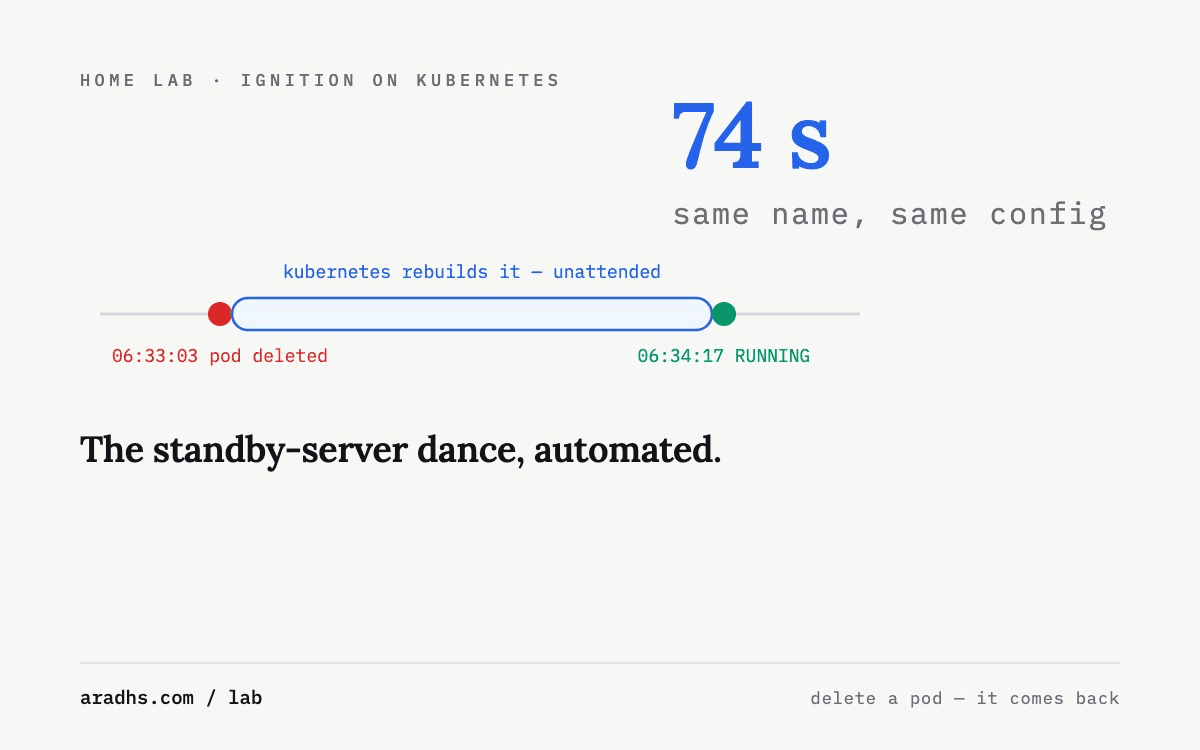
Ignition on Kubernetes: what a home-lab cluster really buys a plant floor
I ran real Ignition 8.3 gateways on a Kubernetes cluster in my home lab — deleted pods on purpose, watched them heal, rolled updates, and stood up two gateways side by side. Real install, real failures, real recovery times. Then the honest verdict for a plant that has no IT team.
Verdict Overkill for one gateway. The right answer the moment you run many — it automates the standby-server dance OT has done by hand, badly, for twenty years.
25 Jul 2026 · 12 min read
 Concluded
TimescaleDB · Docker · Grafana · PostgreSQL
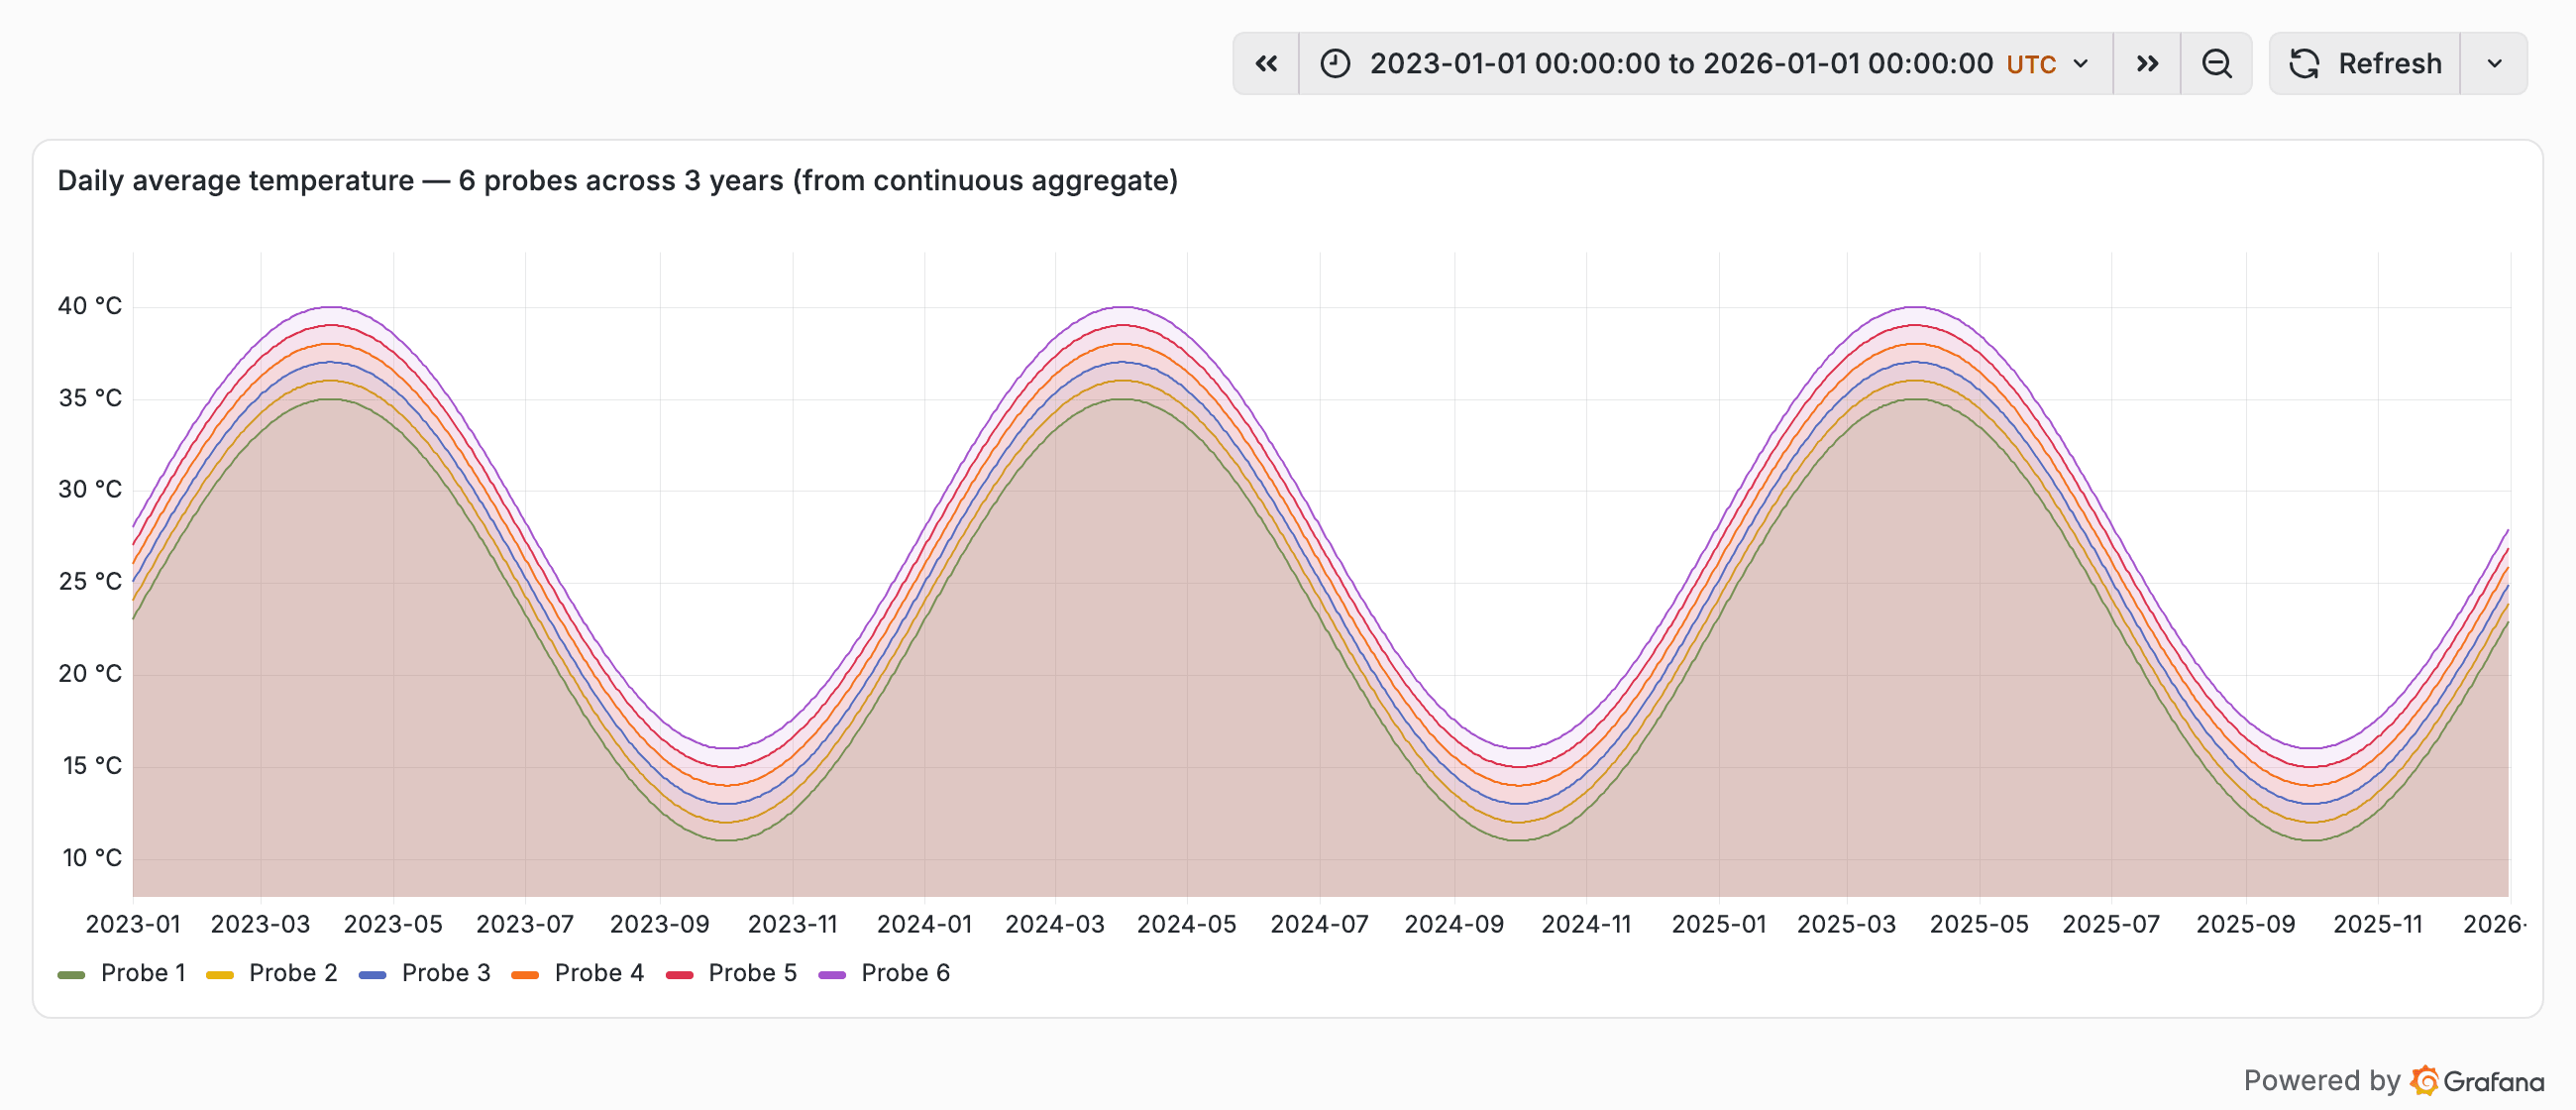
TimescaleDB as a plant historian: a 40-million-row load test on a home lab
Three years of one-minute sensor data — 39.5 million rows — loaded into plain PostgreSQL and a TimescaleDB hypertable on the same box, then compressed, bucketed, and reported on. Real install, real numbers, real Grafana screenshots.
Verdict A hypertable pays a small ingest tax, then returns 3× the disk and reports that run 600–1000× faster.
23 Jul 2026 · 12 min read
 Concluded
OPC UA · asyncua · Basic256Sha256 · Docker · tcpdump · tshark
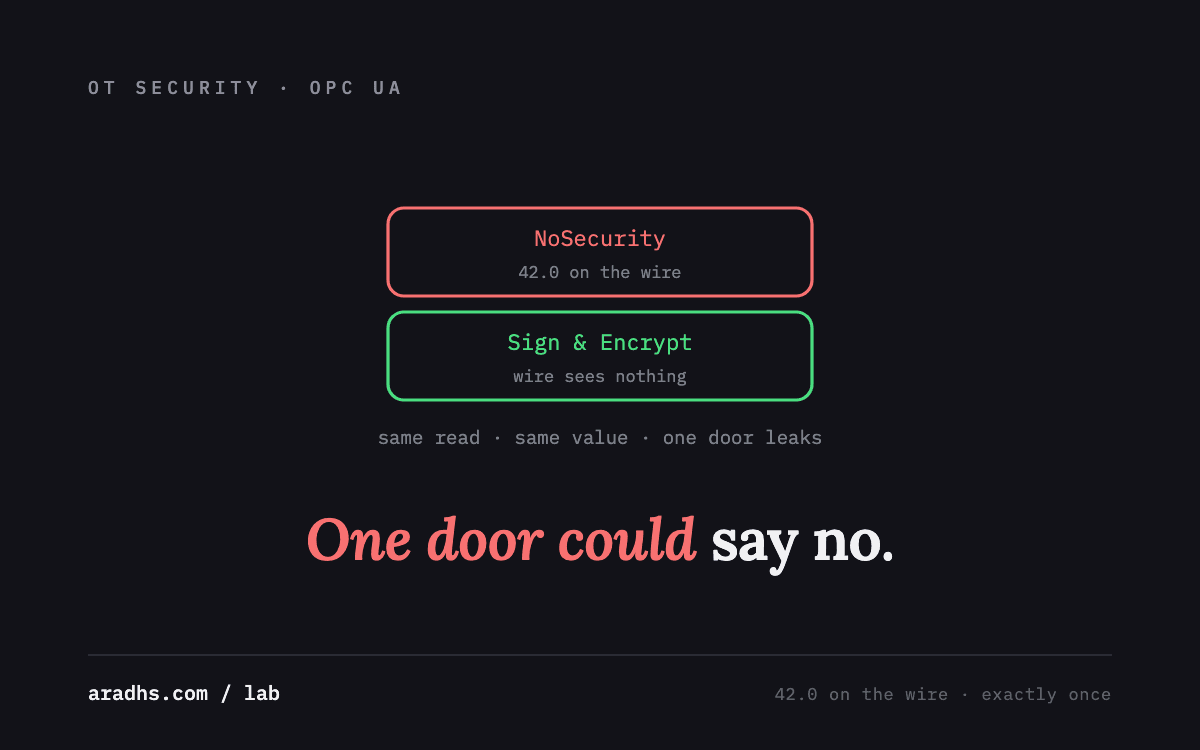
OPC UA: NoSecurity vs Sign & Encrypt on the wire
An OPC UA server offering two endpoints, NoSecurity and Sign & Encrypt, with the same variable behind both. Read it through each door while capturing, and compare what reaches the wire. Full setup with asyncua, the client, and the tshark proof that the value crosses in the clear exactly once.
Verdict OPC UA can defend itself where the earlier protocols cannot. Reading Pump.Speed=42.0 through a NoSecurity endpoint puts the IEEE-754 double on the wire; reading the same value through a Sign & Encrypt endpoint does not. Across the whole capture the value appears in cleartext exactly once. Both modes are offered by the same server; None is the default posture. Setup and captures below.
21 Jun 2026 · 2 min read
 Concluded
MQTT · Mosquitto · Node-RED · Docker · tcpdump · tshark
MQTT: anonymous connect and a spoofed publish
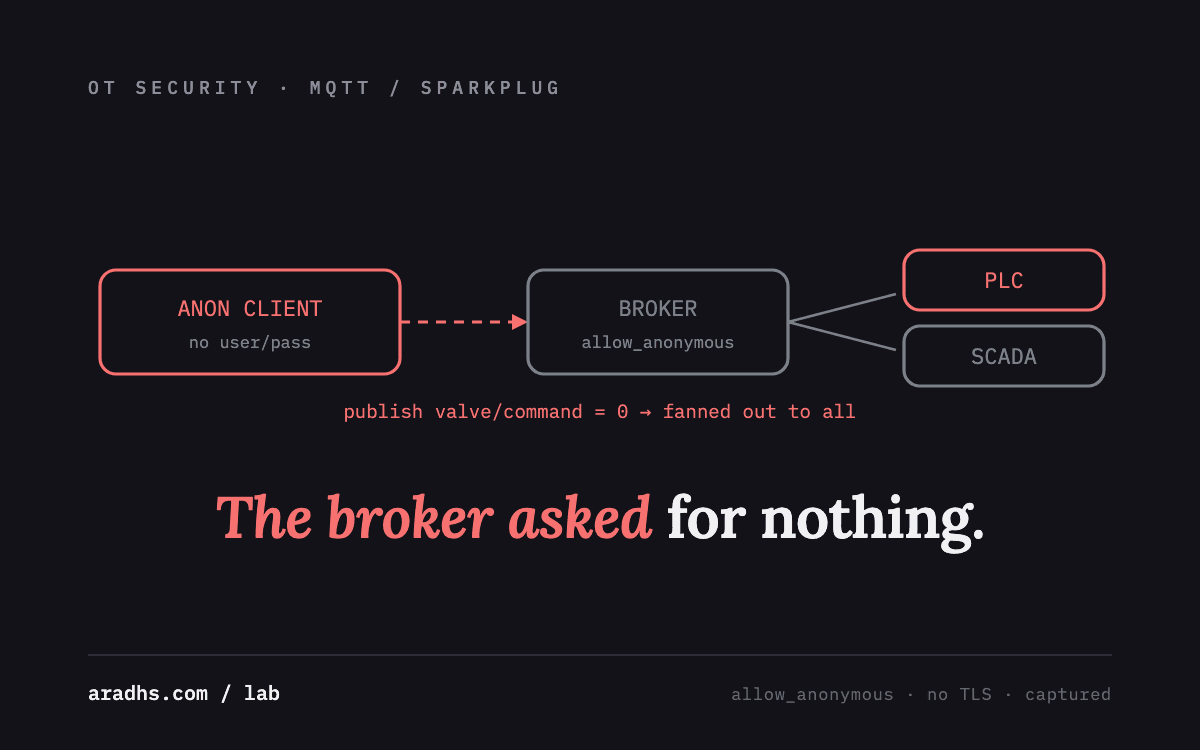
Capture plaintext MQTT on a broker running a tank/pump sim, confirm every CONNECT is anonymous, then publish a control-topic message from an unauthenticated peer and watch the broker fan it out. Full setup, the mosquitto_pub command, and the tshark decodes.
Verdict With allow_anonymous on and no TLS, MQTT is cleartext read and write for anyone on the segment. In the capture, every CONNECT carries no username or password, and an unauthenticated peer (172.22.0.5) publishes to the valve command topic, which the broker accepts and delivers to all subscribers. Unlike Modbus, the fix is protocol-layer: auth, ACLs, TLS, Sparkplug STATE. Setup and captures below.
15 Jun 2026 · 2 min read
 Concluded
EtherNet/IP · CIP · cpppo · S7comm · python-snap7 · Docker · tshark
EtherNet/IP and S7comm: capturing tag and DB writes
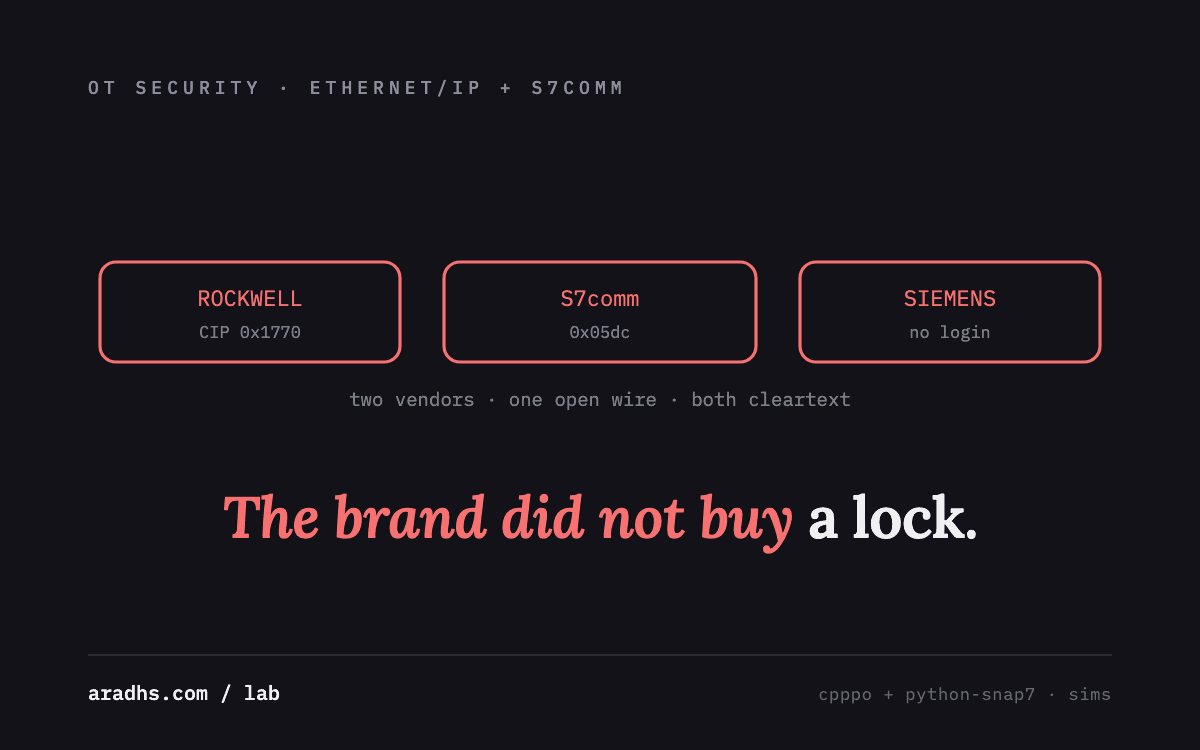
Two vendor sims on an isolated bridge: a Rockwell-style EtherNet/IP tag server (cpppo) and a Siemens-style S7comm server (python-snap7). Full setup, the client commands that write a tag and a data block, and the tshark decodes showing both writes in cleartext with no session credential.
Verdict EtherNet/IP and S7comm behave like Modbus on the wire. A CIP tag write (SETPOINT=6000, 0x1770) and an S7 Write Var to DB1.DBW0 (1500, 0x05dc) both cross in cleartext, and neither RegisterSession nor Setup Communication carries a credential. Vendor answers (CIP Security, S7 access levels) exist but are optional and off by default. Setup and captures below.
9 Jun 2026 · 2 min read
 Concluded
Modbus TCP · Node-RED · @openp4nr/modbus-serial · Docker · tcpdump · tshark
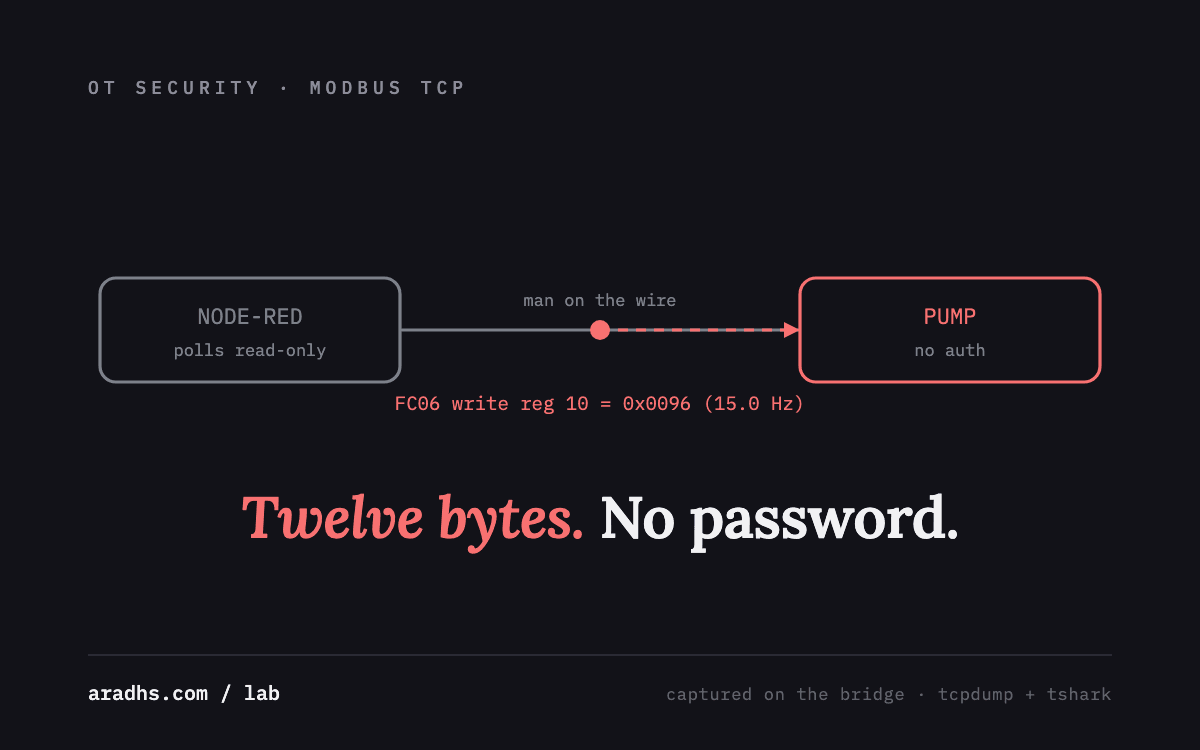
Modbus TCP: capturing an unauthenticated setpoint write
A reproducible lab: sniff live Modbus/TCP between a Node-RED poller and a device sim on an isolated bridge, then write a holding register from a peer with no credential. Full setup, the tcpdump and tshark commands, and the decoded FC06 write down to the twelve bytes.
Verdict Modbus/TCP carries no authentication and no integrity. On the captured conversation, 46 read responses and a Write Single Register (FC06) to the pump speed register all travel in cleartext, and the write is accepted from a host that offered no credential. The register map: holding 10 = speed setpoint, value = Hz x 10. Reproduction and captures below.
4 Jun 2026 · 3 min read
Newsletter
New essays, by email.
SCADA, cloud, AI, and the plant floor — a short email when something new is published. No noise, unsubscribe anytime.