Concluded·30 Jul 2026 · 11 min read
A complete SCADA system for nothing, and what that says about where the money was
FUXA 1.3.3 · Node-RED 4.1 · Mosquitto 2.0.22 · Docker · generated project via REST
Every SCADA quote you have ever read has the same shape. A gateway licence, a tag count, a client count, a development seat, and a line for annual support that renews whether or not anything changed. Somewhere in that number is the graphical editor — the thing that draws tanks and pipes and binds them to tags.
I wanted to know what is left of that number if you remove the licence entirely. So I built a working system: a tank, two pumps, a modulating valve, level alarms, a historian, trends, and writeback from the screen to the process. Then I checked what it cost.
Nothing. Not a trial, not a tag-limited community edition. MIT and Apache licensed, end to end.
The stack
Three containers. That is the whole system.
| Role | Licence | |
|---|---|---|
| FUXA 1.3.3 | SCADA / HMI, historian, trends | MIT |
| Node-RED 4.1 | the process, and the integration tier | Apache 2.0 |
| Mosquitto 2.0.22 | MQTT broker | EPL / EDL |
Everything is in a public repo: github.com/aradhsai/scada-zero.
Clone it, docker compose up -d, run the generator, and you have the screen
below on your own machine.
If two of those three are unfamiliar, here they are in a paragraph each.
Node-RED is the integration tier. You drag small boxes onto a canvas and draw wires between them; each box does one job — read a Modbus register, scale the number, check a limit, publish to MQTT. If you have ever drawn a function block diagram you already think this way. In this build it plays the PLC: it holds the tank model and the pump control logic, and publishes the result. In a real plant it more often sits between the control system and everything that wants its data. The thing that matters about it is not the canvas — it is that a flow is a plain file, so plant integration can be reviewed and versioned like software. I have made that case at length, including where it breaks and where it must never go.
Mosquitto is the MQTT broker — the post office. Node-RED publishes values to
named topics like northwind/rotterdam/T101/level; FUXA subscribes to the ones
it cares about. Neither knows the other exists, which is the whole point:
publish once, subscribe many, instead of every consumer polling the device
directly. It is an Eclipse Foundation project, it is about as boring and
dependable as infrastructure gets, and it runs in a few megabytes. If you want
the argument for why this topology beats point-to-point integration, that is
the unified namespace pattern — this stack is a
small, honest instance of it.
A process, not a sine wave
Demo HMIs usually wobble a value between two limits and call it a plant. That teaches you nothing about whether the tooling holds up, because nothing on the screen ever has to be right.
So T-101 is integrated from a mass balance:
dV/dt = Qin - Qout
level = V / (area x height) x 100
dt comes from the clock rather than being assumed, so a slow tick does not
quietly change the process gain. The inlet valve is rate-limited to 12 %/s of
travel. Pump speed ramps rather than stepping. Runtime hours accumulate per
pump. Two pumps run duty/standby and the duty rotates on every start, which
is why the hour meters stay within a few hours of each other over a long run.
Pumps start at 78 % and stop at 32 %. LL/L/H/HH alarms sit at 10/20/80/90.
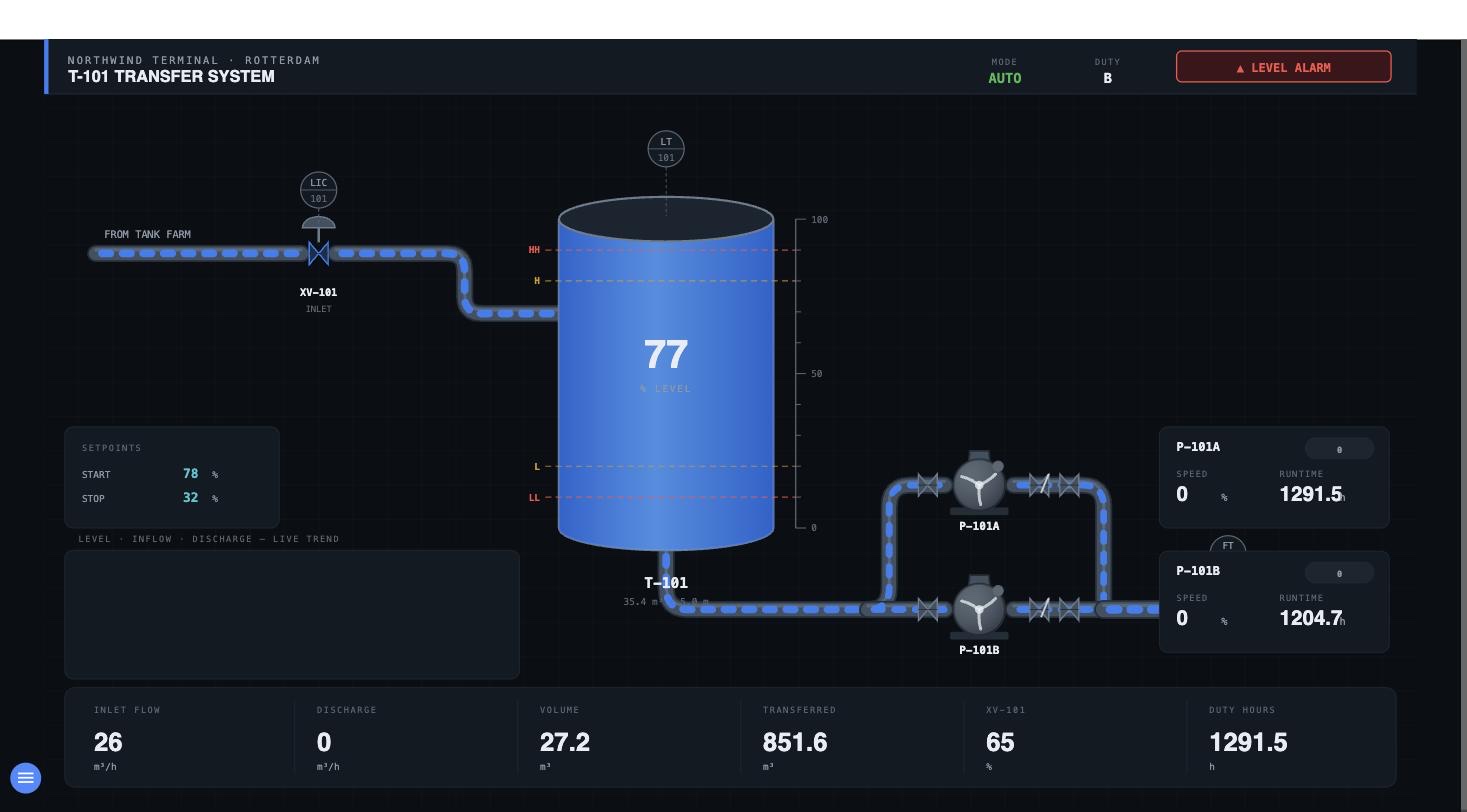
One honest compromise, stated in the code: time runs 20x. At true rates a
duty cycle takes about 35 minutes, which makes for a dead screen. The equations
are untouched and every figure stays dimensionally correct — it just happens
faster. If you clone the repo, SPEED is one constant in the flow.
The interlock, working
A few seconds later the level crosses 78 %. The duty rotates from B to A, P-101A starts, its speed ramps to 100 %, discharge appears on the outlet header at 60 m³/h, and the tank starts drawing down.
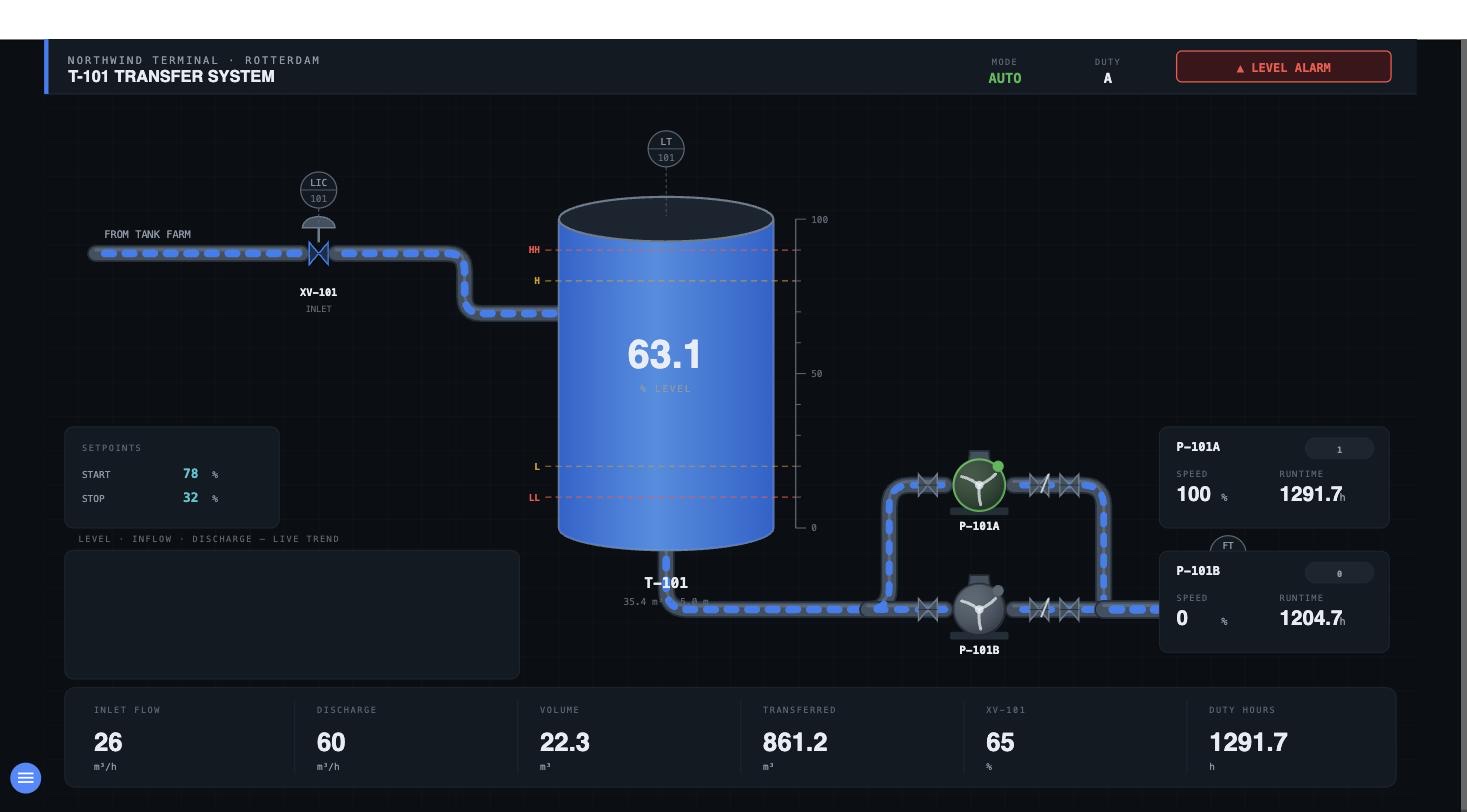
That is the part worth pausing on. Nothing on that screen is a mock-up: the level fell because volume left the tank, the pump is green because a control rule started it, and the hour meter on A is now moving while B's is not.
The screen was never drawn
Here is the part I did not expect to be the interesting one.
I never opened FUXA's graphical editor to build this. The entire project — device, 26 tags, the SVG mimic, and all 36 bindings — is generated by about three hundred lines of Python and posted over the REST API.
generator/
  tags.py            one entry per MQTT topic
  screen.py          the P&ID as code: pipes, ISA symbols, bindings
  build_project.py   assembles the project and posts it
Change a tag, re-run, and the screen is rebuilt identically. The device definition and every screen binding are generated from the same list, so the mimic cannot drift from the process it draws — the same property I have argued matters for gateway configuration and for not having ten copies of the truth.
Pipes are drawn three times each — a dark casing, a mid body and an offset highlight — which is the cheapest way to get a tube to look like a tube in flat SVG. Symbols follow ISA convention: centrifugal pumps as circle plus volute, isolation valves as bowties, check valves with a flap, instruments as balloons with tag numbers. All of it is a function call.
What it cost me instead: the documentation
The licence is free. The learning is not.
FUXA's documentation is 24 markdown files that are mostly animated GIFs. There is no schema reference. Every load-bearing fact in this build came from reading the shipped artifacts: the TypeScript models, the built client bundle, the server-side MQTT driver, and the example project inside the container image.
Six findings, none documented. They are all in the repo's README, and this is the one that cost the most:
A gauge's
variableIdmust equal the tag id the server puts on the wire. The client keys its variable map on that value verbatim. For an MQTT device the frame carries the bare tag id, so the binding ist101_level— notdeviceName^~^tagId. The^~^form is what the editor writes and what the bundled example project contains. Copying the example binds nothing, and fails silently.
Two more worth naming for anyone attempting this:
clientAccess.scriptSystemFunctionsis mandatory, even though the bundled example omits the wholeclientAccesskey. It is dereferenced on every HMI load; if it is missing the load aborts before any gauge binds — and the SVG still renders, so it presents as a binding problem rather than a crash. That one had me chasing the wrong layer for hours.POST /api/projectstores without re-initialising the runtime. Follow it with/api/projectDatacommands, which callruntime.update().
The lesson generalises past FUXA. When a project ships an example, treat it as a valid document, not as the runtime contract. In this case the editor and the runtime disagreed with each other, and the example sided with the editor.
What actually found the bug
Four hypotheses in a row were wrong, all of them plausible, all argued from reading source. What settled it was a measurement: I opened a raw socket.io connection from the browser console and read the frames.
const ws = new WebSocket(`wss://${location.host}/socket.io/?EIO=4&transport=websocket`);
ws.onopen = () => ws.send('40');
ws.onmessage = e => { /* log 42[...] frames */ };
42["device-values",{"id":"T101","values":[
{"id":"t101_level","value":33.8,"timestamp":1785421248743}, ...]}]
Values were arriving at the browser with correct ids and real data. Server to browser: working. Browser to SVG: not. One observation cut the problem in half and pointed straight at the key mismatch. I should have done it four hypotheses earlier.
History, since nobody documents this either
FUXA logs to SQLite, per device, in server/_db/:
daq-map_<device>.db—data(mapid, id, name, type), an integer per tagdaq-data_<device>_<stamp>.db—data(dt, id, value), keyed by that integer
Integer keys keep rows small. Files roll every daqTokenizer hours and archive.
If SQLite is not enough, InfluxDB, QuestDB and TDengine backends ship in
runtime/storage/.
One trap: currentTagReadings.db only holds tags marked restored. It is not a
live-value view, and reading it as one sent me down a false trail early.
Where an OT engineer should and should not put this
I am not going to tell you this replaces your DCS. It does not, and the reasons are not about features.
Reasonable today
- Monitoring and reporting layers that currently justify a second gateway licence
- Small standalone plants: package units, booster sets, water treatment skids
- The integration tier, where Node-RED already quietly runs in most plants
- Training rigs and test benches, where per-seat licensing hurts most
- Anywhere you want the screen in version control rather than in a backup file
Not yet
- No redundancy story. There is no active/standby pairing. A plant that needs continuous visibility needs a plan FUXA does not provide.
- Thin audit trail. If you need to answer who changed that setpoint at 02:14, this is not the tool.
- No safety case. Nothing here is rated for anything, and nobody is on the end of a support contract at 3am.
- Small community. Compared with the incumbents, the number of people who have hit your problem before is small — this build is evidence of that.
That is a real list and I would not wave it away. But notice what is not on it: the graphics, the alarms, the historian, the trends, the protocol support. Those work.
Why this is moving
The interesting question is not whether the free stack is good enough. It is why the free stack got good enough now, when it plainly was not a decade ago.
The web ate the HMI. SCADA graphics used to require a proprietary rendering
engine and a proprietary editor, and both were genuinely hard to build. Then the
browser became a competent graphics platform, and drawing a mimic became SVG in
a <div>. FUXA is a web app. So is Ignition Perspective. So is nearly every
new HMI shipped in the last five years. The moat drained when the rendering
problem became a solved commodity.
Then the editor stopped being scarce too. This is the part that changed most recently, and this build is the demonstration. The graphical editor was one of the last things you were really paying for — the accumulated effort of making tank shapes and binding dialogs and animation properties. I never opened it. The mimic on this page, ISA symbols and shaded pipes and all, is a Python file. When the visual layer can be generated as easily as it can be drawn, the editor stops being a differentiator and becomes a convenience.
Protocols standardised underneath. MQTT, OPC UA and Sparkplug B mean the southbound driver — the other genuinely hard part — is increasingly a shared component rather than a vendor asset.
What that leaves the incumbents is the part that was always the real product and was never the screen: redundancy, support, certification, the installed base, and somebody to call. Those are worth paying for. Nobody at a water utility is choosing a SCADA platform because its tank shapes are nicer.
So the direction of travel is not "everyone switches to free SCADA." It is that the price of the visual layer is converging on zero, and vendors will increasingly be sold on the things a repository cannot give you. If your quote still has a line item that is really about drawing pictures, that line item is living on borrowed time.
Try it
git clone https://github.com/aradhsai/scada-zero
cd scada-zero
docker compose up -d
cd generator && python3 build_project.py
FUXA on :1881, Node-RED on :1880. Every port binds to loopback — reach it
over a VPN rather than publishing it, and the broker's anonymous access is fine
on a lab bench and nowhere else.
References
- FUXA — the SCADA/HMI platform, MIT
- Node-RED — flow-based integration, Apache 2.0
- Eclipse Mosquitto — MQTT broker, EPL/EDL
- scada-zero — this build, with all six undocumented findings written up in the README
Known rough edges
Kept honest rather than tidied away:
- The pump status pills render
0/1instead of STOPPED/RUNNING. FUXA's value gauge does not substitute text through ranges; that needs a different gauge type. Run state is still unambiguous from the casing colour and the run LED. - The trend chart is wired and the historian is logging, but it needs history to accumulate before it draws anything useful.
- Renaming a device orphans its old
daq-*files. Clean them up.
Newsletter
New essays, by email.
SCADA, cloud, AI, and the plant floor — a short email when something new is published. No noise, unsubscribe anytime.